Murrey Math Lines 13.12.2017 (USD/JPY, USD/CAD)
USD JPY, “US Dollar vs. Japanese Yen”
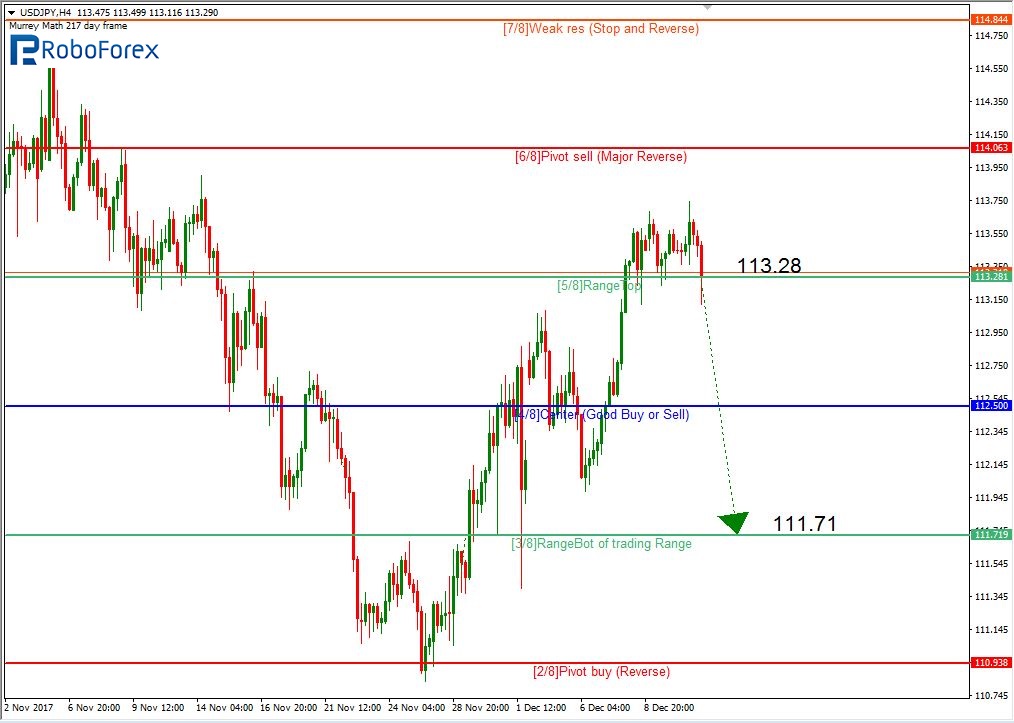
As we can see at the H4 chart, the USD/JPY pair is trading near the 5/8 level (113.28). If the price fixes below this level, the instrument may continue falling towards the 3/8 one (111.71).
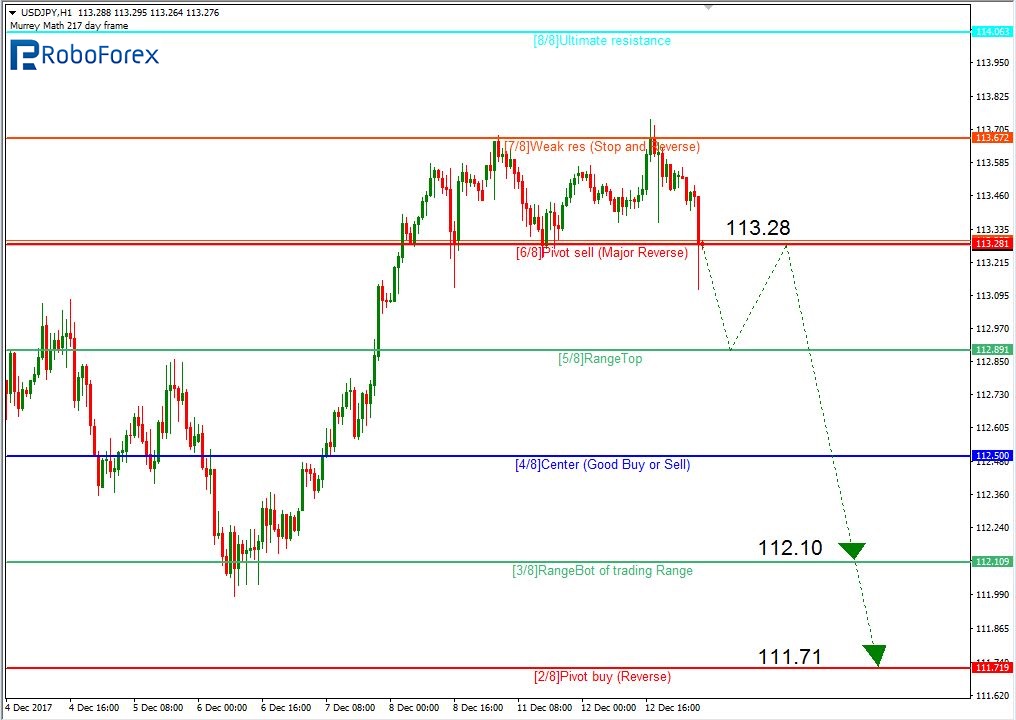
At the H1 chart, the pair may break the 6/8 level (113.28) and continue moving downwards to reach the 5/8 one where it is expected to start a new correction, which may later у followed by further decline.
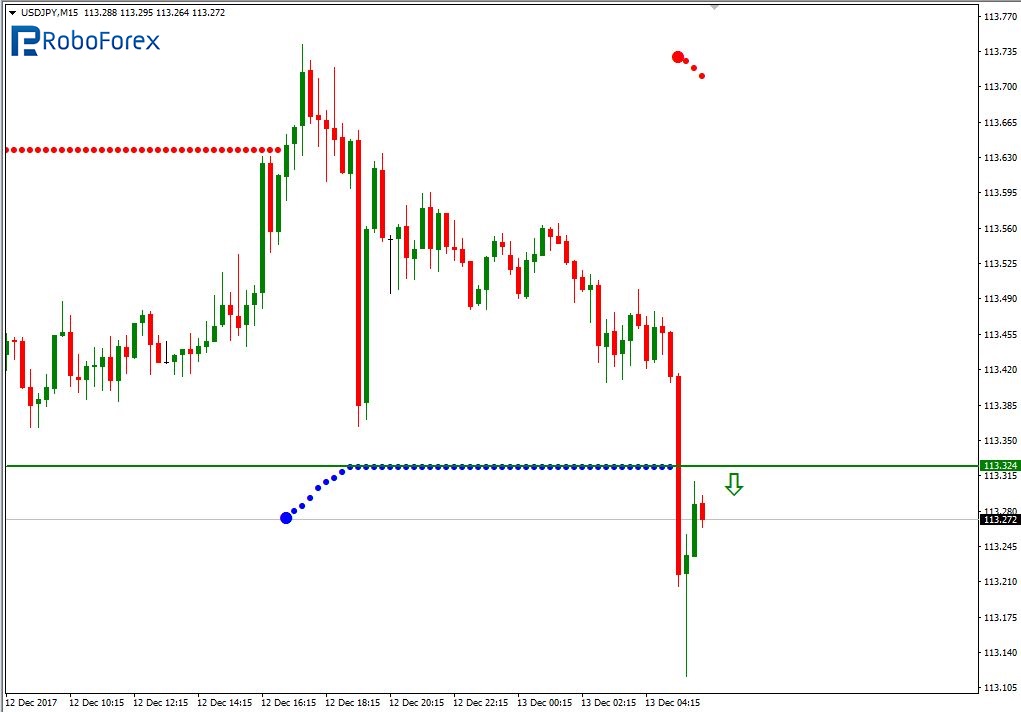
As we can see at the M15 chart, the pair has broken the downside line of the VoltyChannel indicator and, as a result, may continue falling.
USD CAD, “US Dollar vs Canadian Dollar”
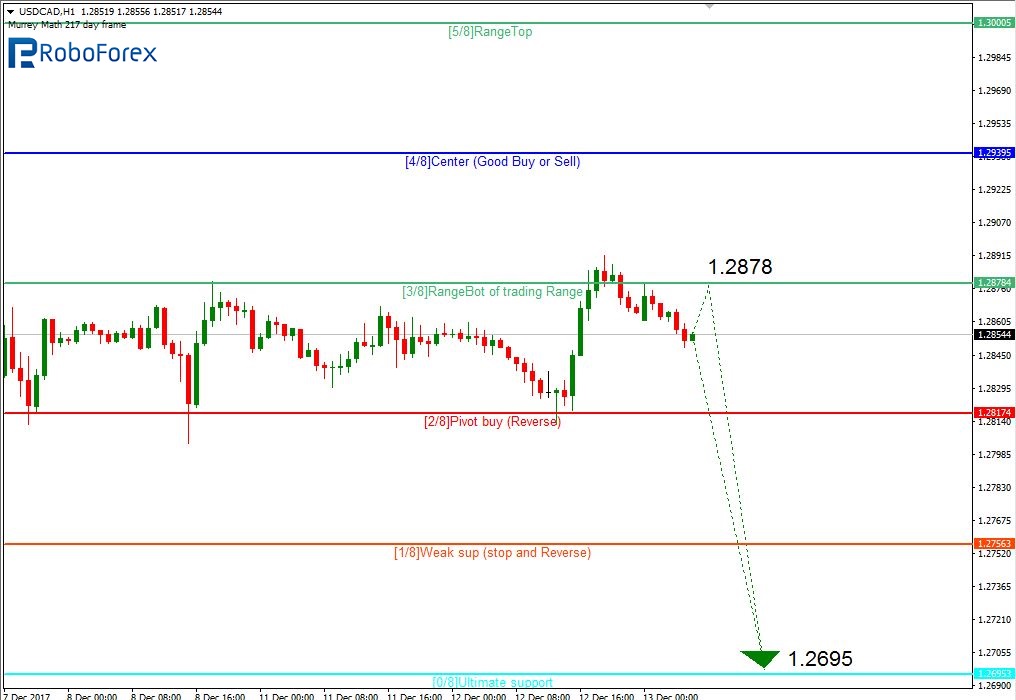
As we can see at the H4 chart, the USD/CAD pair hasn’t been able to break the 3/8 level (1.2878). In this case, the price is expected move downwards and reach the support at the 0/8 level (1.2695).
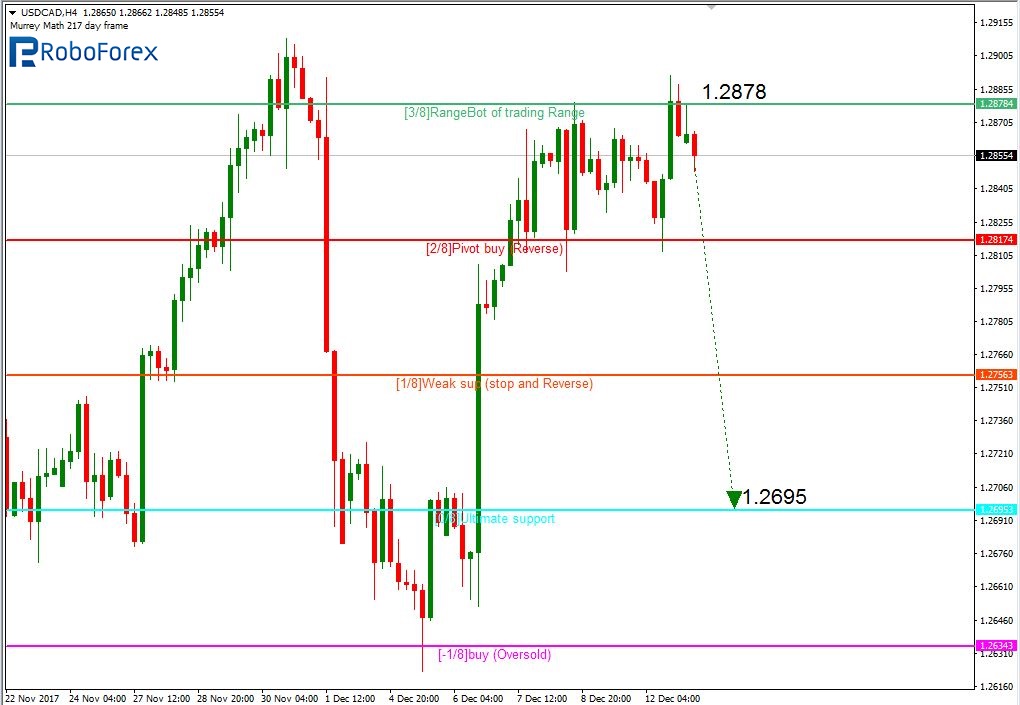
The lines at the H4 and H1 charts are completely the same, so they confirm the scenario described above, according to which the price may fall towards the support at the 0/8 level (1.2695). Possibly, the pair may test the 3/8 level (1.2878) again.
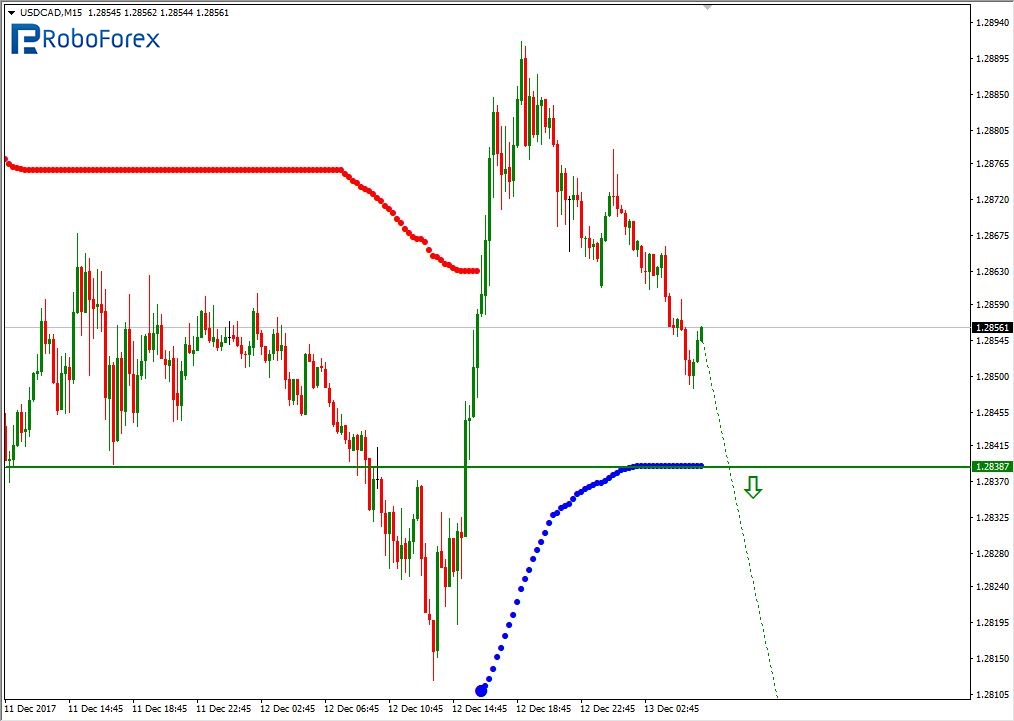
At the M15 chart, the pair may break the downside line of the VoltyChannel indicator and, as a result, continue falling to reach the main target at 1.2695.
RoboForex Analytical Department
Forecasts presented in this section only reflect the author’s private opinion and should not be considered as guidance for trading. RoboForex bears no responsibility for trading results based on trading recommendations described in these analytical reviews.