Wave Analysis 27.12.2012 (DJIA Index, Crude Oil)
27.12.2012
Analysis for December 27th, 2012
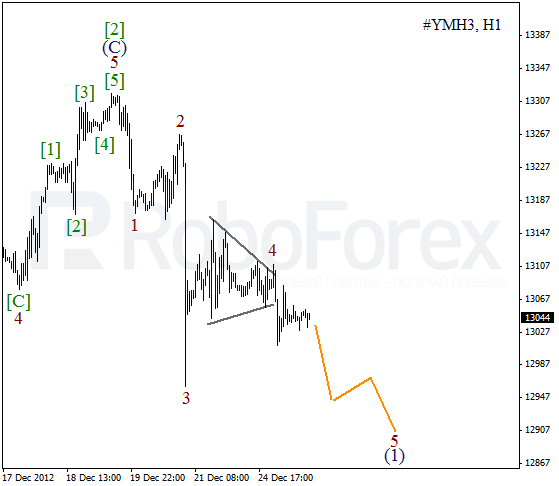
DJIA Index
We may assume that the Index is still forming a descending impulse. Earlier the price completed an ascending zigzag pattern inside wave [2]. Most likely, the instrument will continue falling down in the nearest future.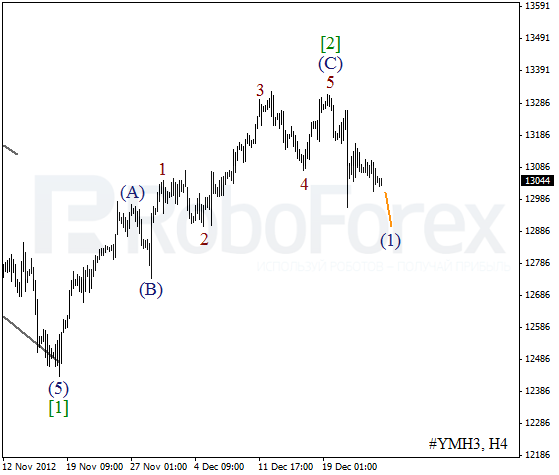
More detailed wave structure is shown on the H1 chart. The price completed horizontal triangle pattern inside the fourth wave. In the near term, we can expect the Index to start a new descending movement.
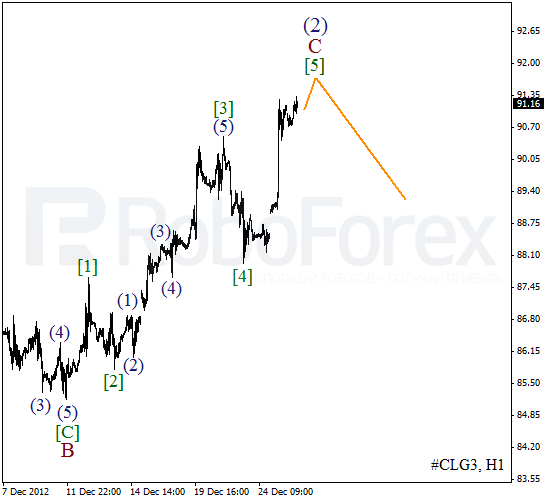
Crude Oil
It looks like double three pattern inside the second wave transformed into flat. On the minor wave level the price is completing an impulse inside wave C. One of these days Oil is expected to make a reverse and start a new descending movement inside the third wave.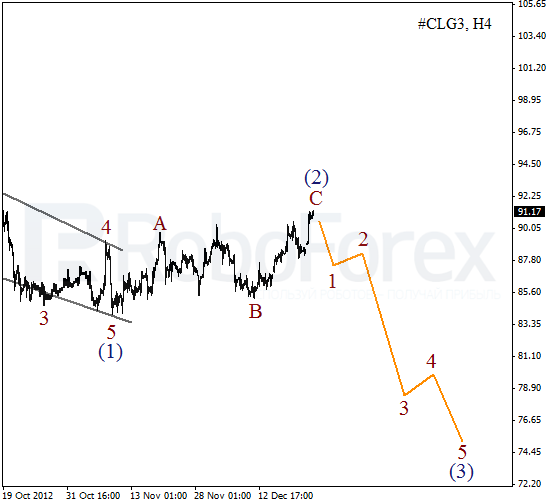
More detailed wave structure is shown on the H1 chart. We can see that the price is about to complete wave [5]. Most likely, Oil will form several more ascending waves, but later we can expect it to make a reverse downwards.
RoboForex Analytical Department
Attention!
Forecasts presented in this section only reflect the author’s private opinion and should not be considered as guidance for trading. RoboForex bears no responsibility for trading results based on trading recommendations described in these analytical reviews.