Fibonacci Retracements Analysis 01.10.2019 (EURUSD, USDJPY)
EURUSD, “Euro vs US Dollar”
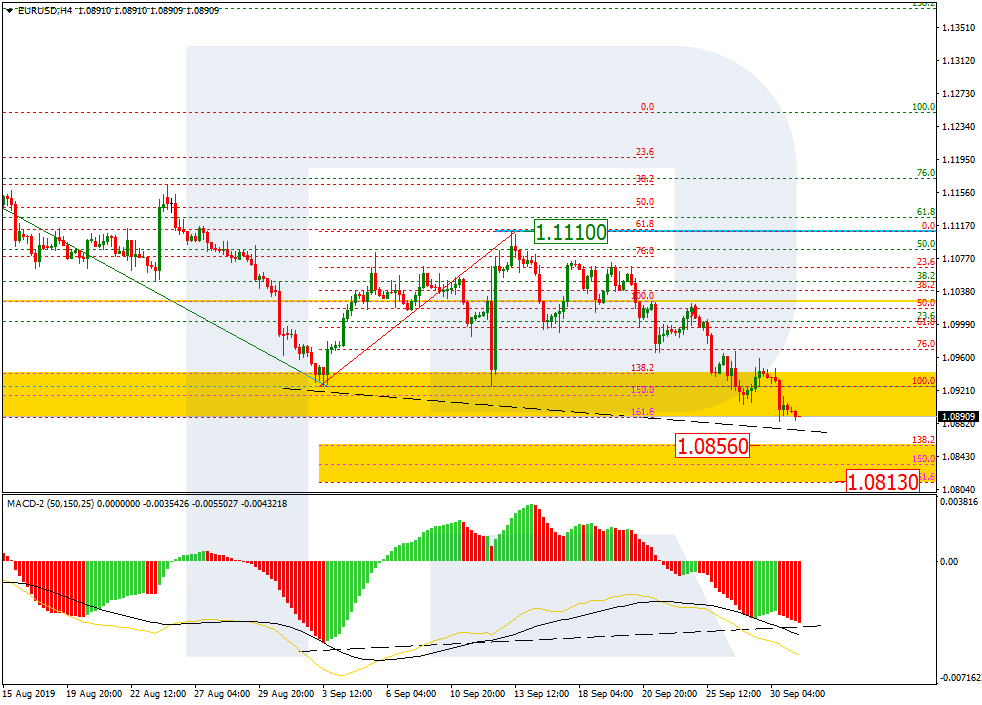
As we can see in the H4 chart, after finishing the correction by breaking the key low, EURUSD has closed the first post-correctional extension area between 138.2% and 161.8% fibo at 1.0942 and 1.0889 respectively. The current decline is heading towards the next post-correctional extension area between 138.2% and 161.8% fibo at 1.0856 and 1.0813 respectively. The long-term downtrend is looking quite stable, but there is a convergence on MACD, which may indicate a possible reverse soon. The resistance is at 1.1110.

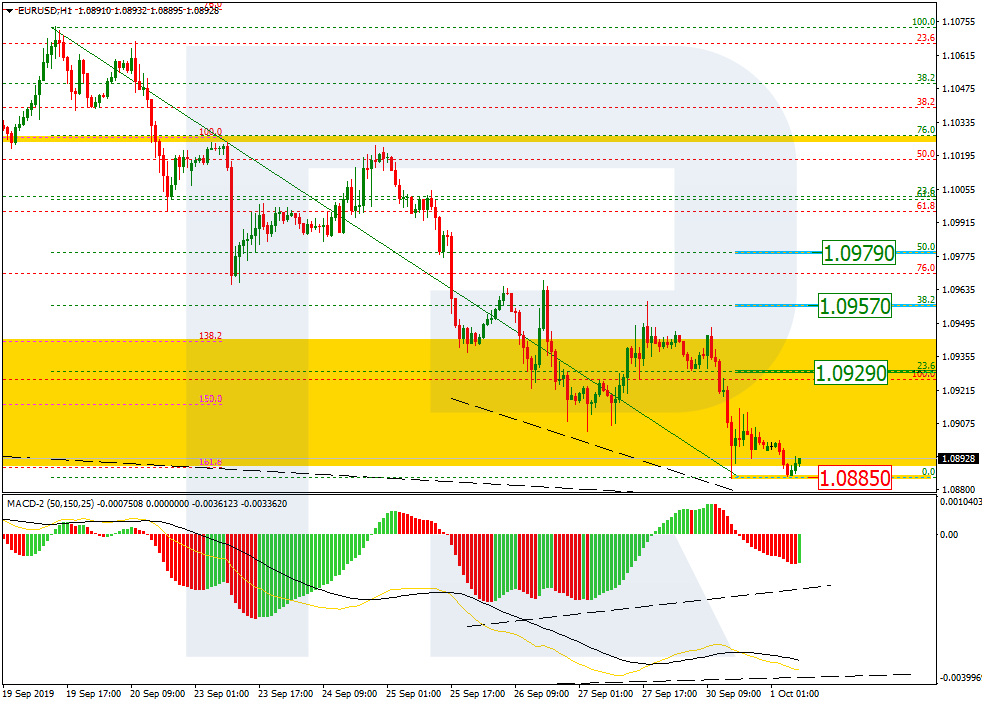
Looking at the H1 chart, we may assume that the current descending wave is looking stable with a short pause close to the downside border of the post-correctional extension area between 138.2% and 161.8% fibo at 1.0942 and 1.0889 respectively. At the same time, there is a local convergence on MACD. Taken together, these factors may indicate a possible pullback in the future. The targets may be at 23.6%, 38.2%, and 50.0% fibo at 1.0929, 1.0957, and 1.0979 respectively.
USDJPY, “US Dollar vs. Japanese Yen”
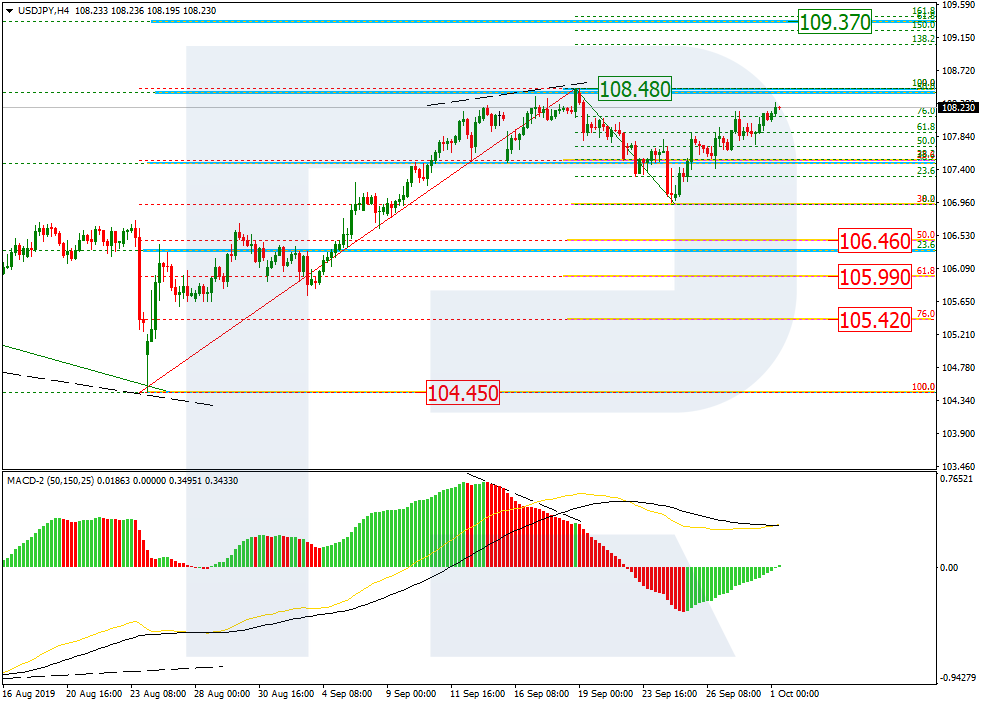
As we can see in the H4 chart, having completed the correctional downtrend at 38.2% fibo, USDJPY is starting a new ascending wave. In the future, there are two possible scenarios: the pair either rebounds from the high or breaks it. If the market fails to break the high at 108.48, the instrument may start a new descending wave to reach 50.0%, 61.8%, and 76.0% fibo at 106.46, 105.99, and 105.42 respectively. Otherwise, the price may reach the mid-term correctional target at 61.8% fibo at 109.37.
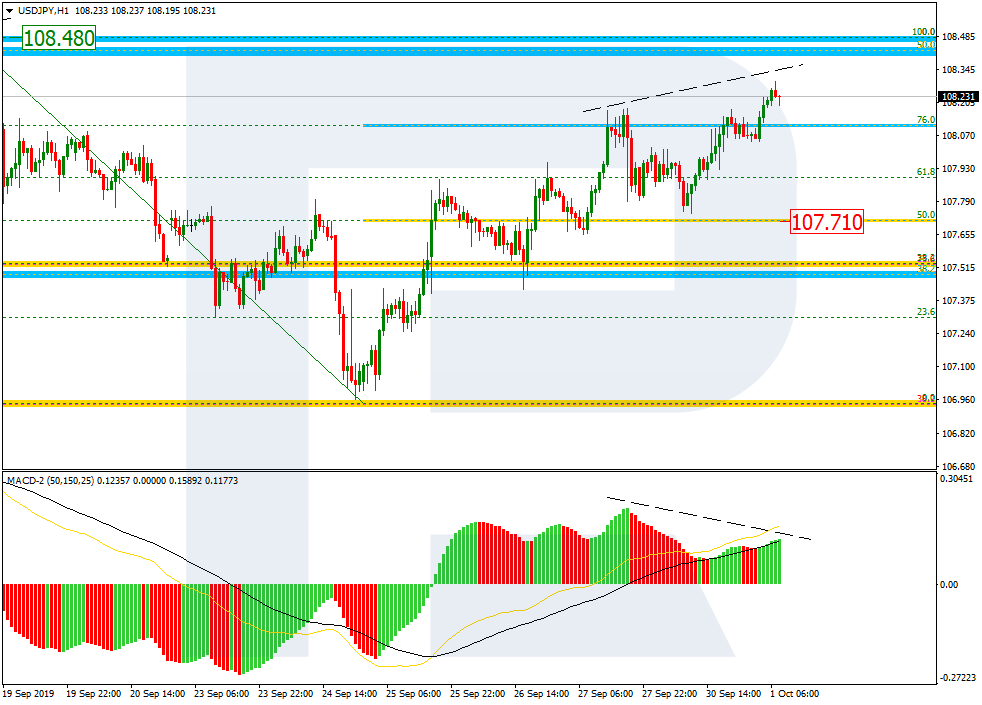
In the H1 chart, after reaching 76.0% fibo, the pair heading towards the high. However, there is a local divergence on ACD, which may indicate a new pullback after the price reached the resistance near the high. The target of this pullback may be the support at 50.0% fibo at 107.71.
Forecasts presented in this section only reflect the author’s private opinion and should not be considered as guidance for trading. RoboForex bears no responsibility for trading results based on trading recommendations described in these analytical reviews.