Fibonacci Retracements Analysis 10.12.2018 (GOLD, USDCHF)
XAUUSD, “Gold vs US Dollar”
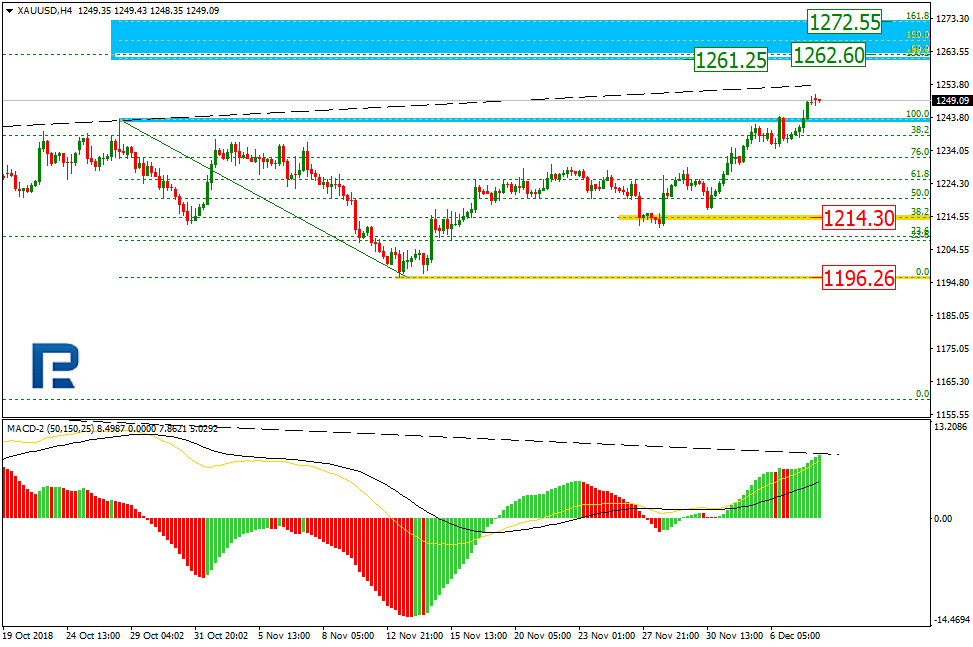
As we can see in the H4 chart, the uptrend has already broken the previous high and may continue growing towards the long-term retracement of 50.0% at 1262.60, which is inside the post-correctional extension area between the retracements of 138.2% and 161.8% at 1261.25 and 1272.55 respectively. The local support level is at 1214.30, the key one – 1196.26.

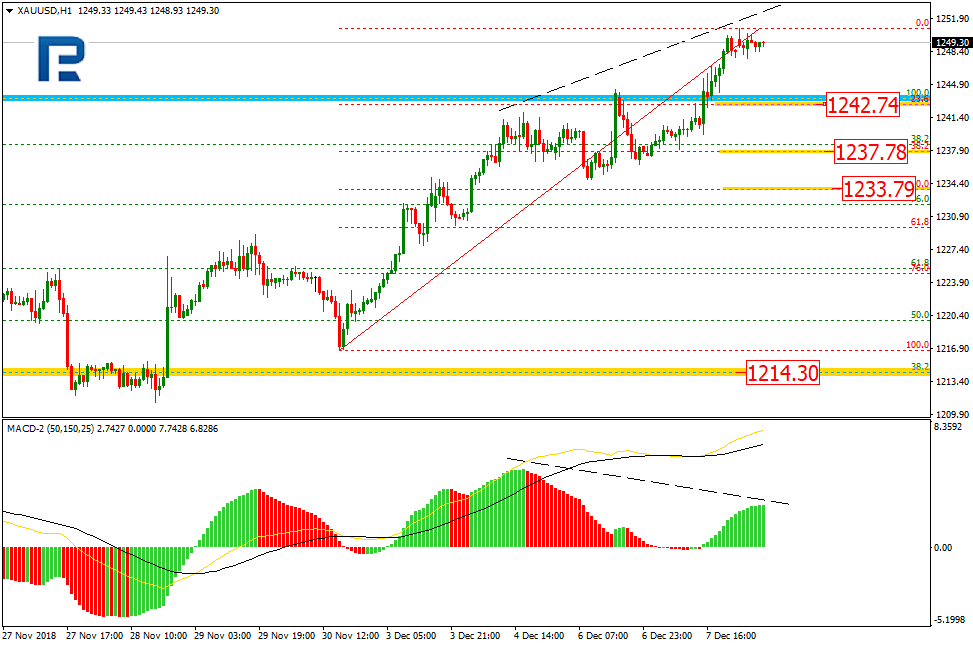
In the H1 chart, the pair is trading upwards, but there is a divergence on MACD at the same time, which may indicate a new correction soon. The possible correctional targets may be the retracements of 23.6%, 38.2%, and 50.0% at 1242.74, 1237.78, and 1233.79 respectively.
USDCHF, “US Dollar vs Swiss Franc”
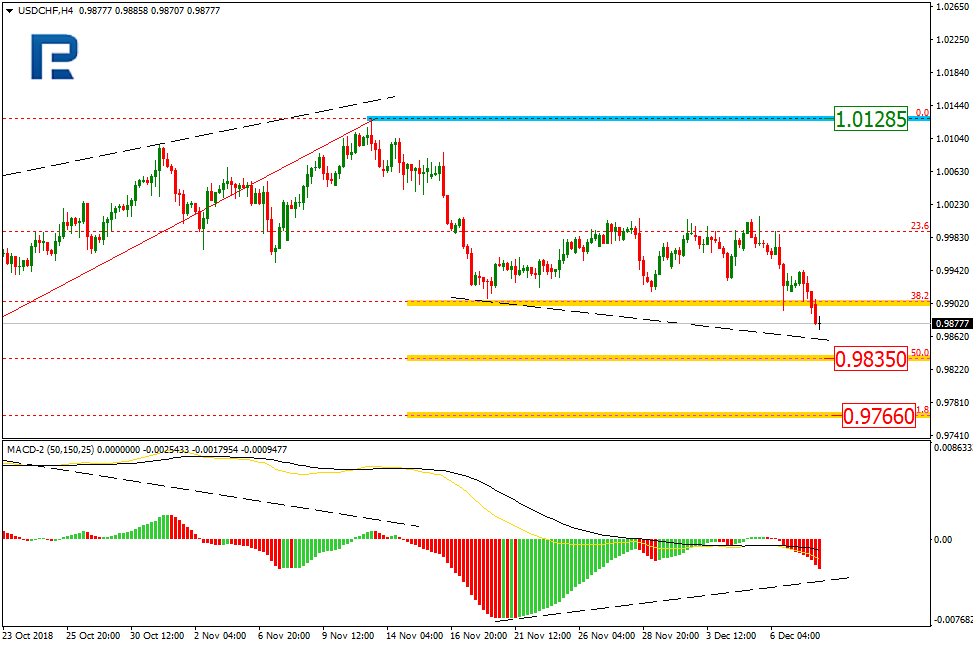
As we can see in the H4 chart, USDCHF has stopped trading sideways and broken the correctional channel to the downside. The mid-term downtrend continues towards the retracements of 50.0% and 61.8% at 0.9835 and 0.9766 respectively. At the same time, there is a convergence on MACD.
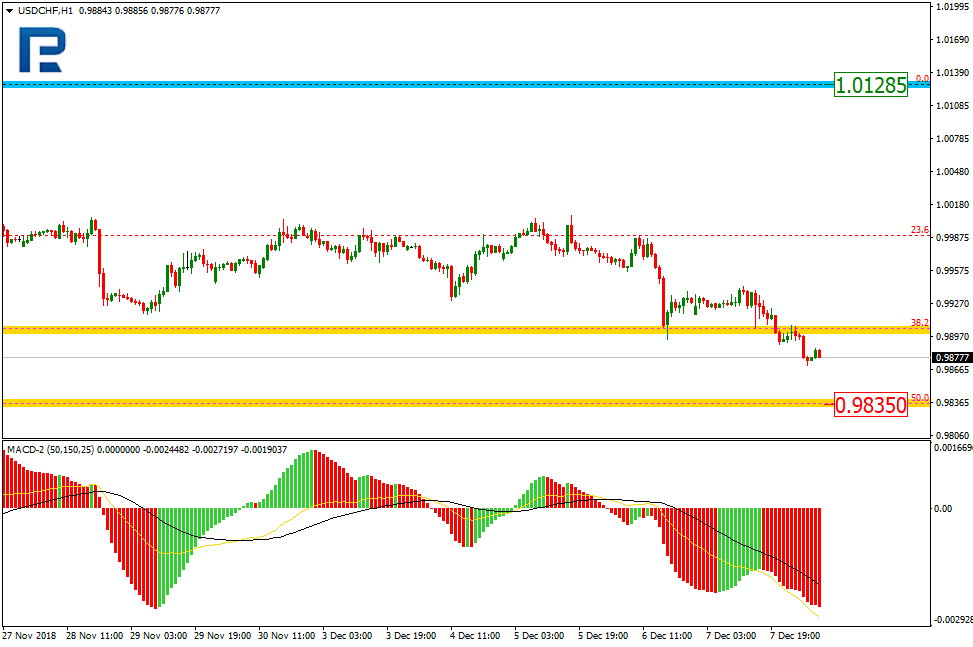
In the H1 chart, the pair is getting close towards the retracement of 50.0% at 0.9835.
Forecasts presented in this section only reflect the author’s private opinion and should not be considered as guidance for trading. RoboForex bears no responsibility for trading results based on trading recommendations described in these analytical reviews.