Fibonacci Retracements Analysis 17.02.2020 (GOLD, USDCHF)
XAUUSD, “Gold vs US Dollar”
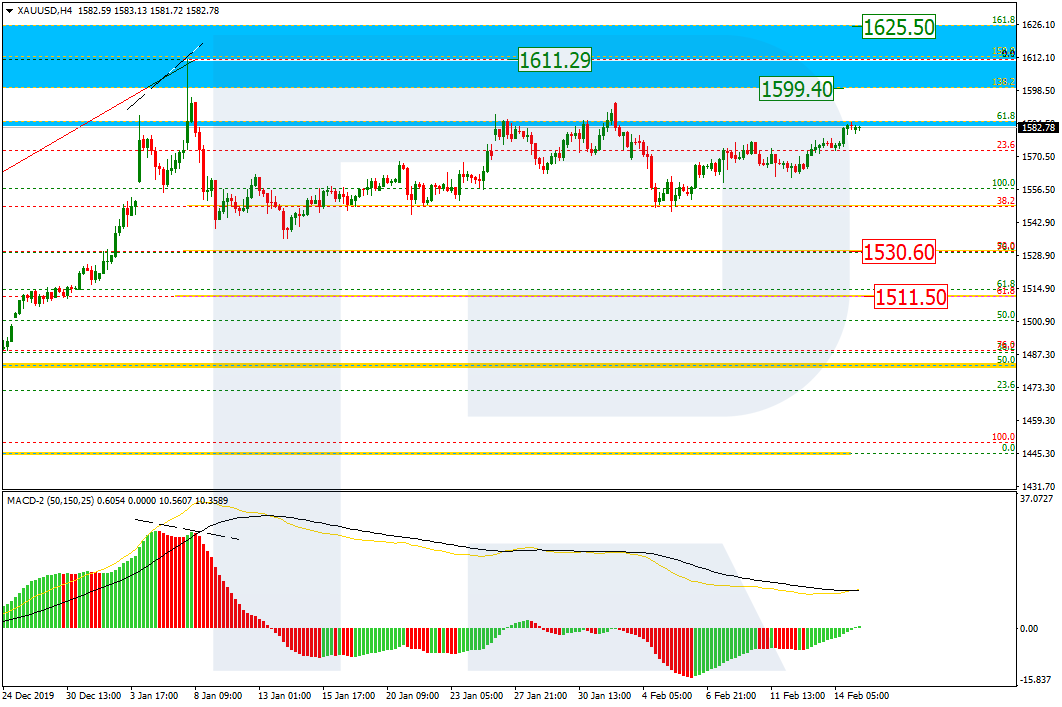
As we can see in the H4 chart, correctional waves that follow each other are forming a Triangle pattern. After re-testing 38.2% fibo, XAUUSD is forming another rising wave. The major scenario implies that the pair may break the current high at 1611.29 and reach the post-correctional extension area between 138.2 and 161.8% fibo at 1599.45 and 1625.70 respectively. However, another scenario suggests that the instrument may continue its decline towards 50.0% and 61.8% fibo at 1530.60 and 1511.50 respectively.

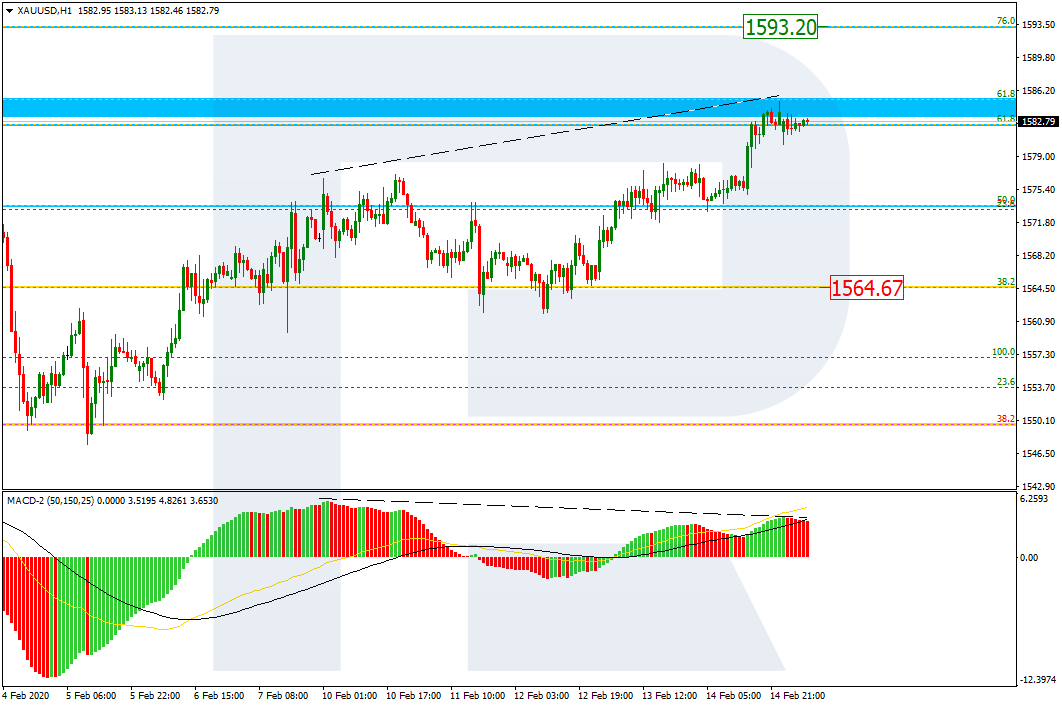
In the H1 chart, the uptrend has reached 61.8% fibo and may yet continue towards 76.0% fibo at 1593.20. However, there is a divergence on MACD, which may indicate a possible pullback soon; the target may be the support at 38.2% fibo (1564.67).
USDCHF, “US Dollar vs Swiss Franc”
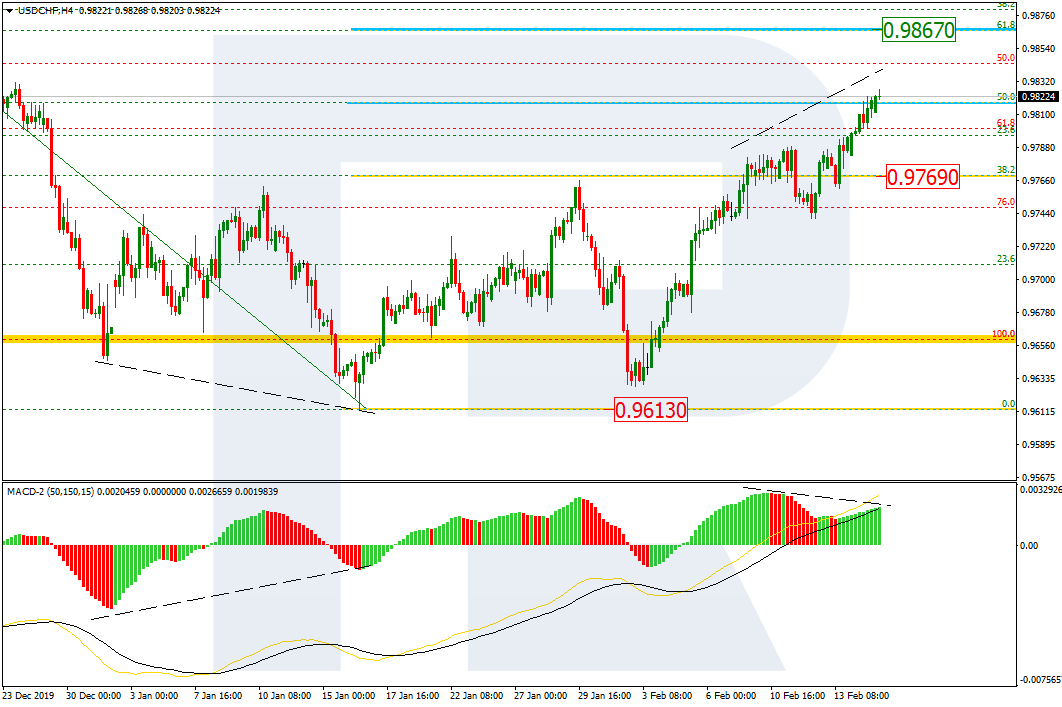
As we can see in the H4 chart, the rising wave has already reached 50.0% fibo. The next upside target may be 61.8% fibo at 0.9867. At the same time, there is a divergence on MACD, which may force a pullback. The support is 38.2% fibo at 0.9613.
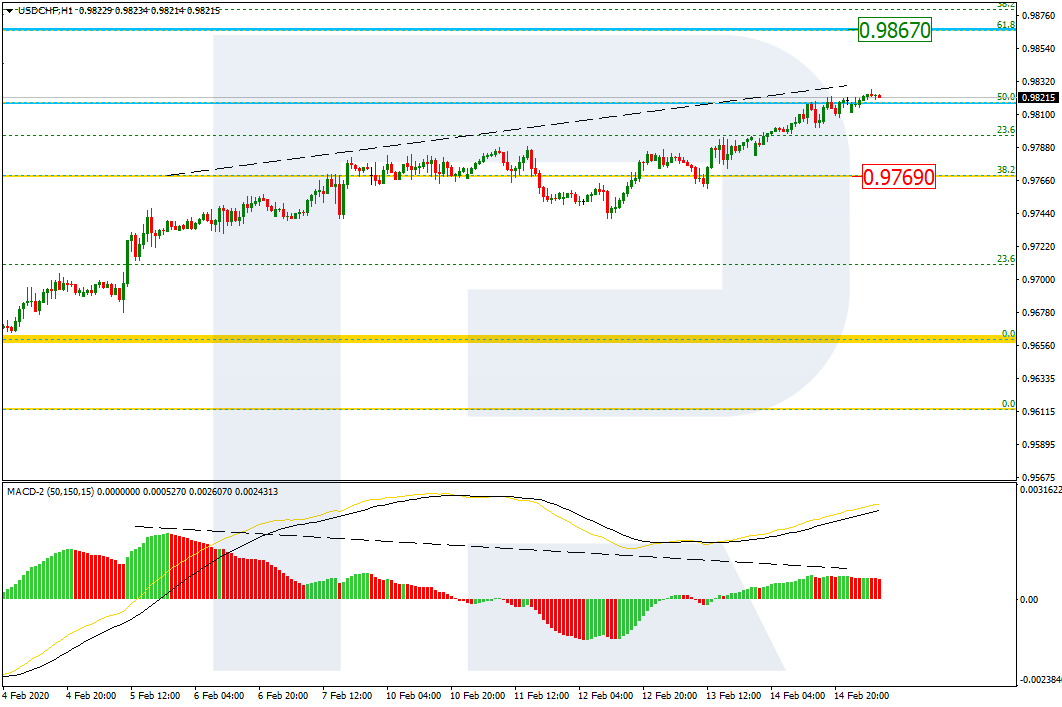
The H1 chart shows a more detailed structure of the current uptrend with a divergence on MACD. The pair has already reached 61.8% fibo and right now it testing it.
Forecasts presented in this section only reflect the author’s private opinion and should not be considered as guidance for trading. RoboForex bears no responsibility for trading results based on trading recommendations described in these analytical reviews.