Forex Technical Analysis 2012/07/05 (EUR/USD, GBP/USD, USD/CHF, USD/CAD) Forecast FX
04.05.2012
Forecast for May 7th, 2012
EUR/USD
Although the EUR/USD currency pair has left the descending channel, it hasn’t started moving upwards. At the moment there is a possibility that the price may form a reversal pattern at the daily chart of the pair. Aggressive traders are advised to consider buying the pair from the current levels. If the price falls down lower than 1.3100, this scenario will be cancelled. Conservative traders are recommended to buy Euro with the stop below 1.3120 only after the price breaks the level of 1.3170. The closest target of the growth is the area of 1.3235. Judging by the daily chart analysis we can see that the price is still moving inside “triangle” pattern, however, there is a possibility that the pattern may be broken upwards.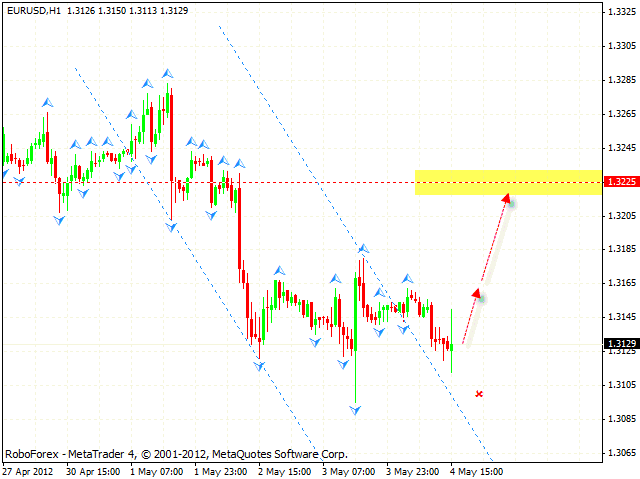
GBP/USD
The GBP/USD currency pair tends to be a bit unstable. At the daily chart the price is stuck inside “triangle” pattern, one can consider opening positions only after the pattern is broken in that very direction. Judging by the H4 chart analysis we can see that the price is still moving inside the ascending channel, the target of the growth is the area of 1.6315. The RSI indicator is testing the trend’s ascending line, thus indicating that Pound may grow up. One can consider buying the pair only after the price breaks the level of 1.62. Aggressive traders can try to open long positions from the current levels with the stop below 1.6155.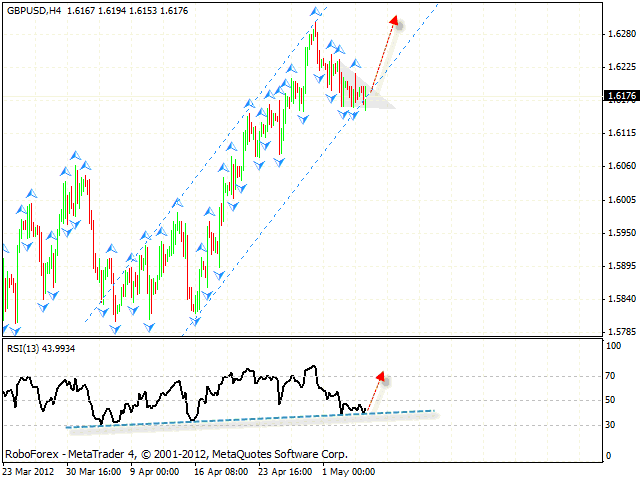
USD/CHF
The daily chart of the USD/CHF currency pair indicates that the price may start moving downwards. The RSI indicator is testing the trend’s descending line, there is a resistance level. At the H1 chart of the pair there is also a possibility that Franc may fall down from the current levels, the target of the fall is the area of 0.9075. Aggressive traders are recommended to sell the pair with the tight stop from the current levels. Conservative traders are advised to wait until Franc falls down lower than 0.9125 and then try to sell it. If the price grows up higher than 0.9170, this scenario will be cancelled.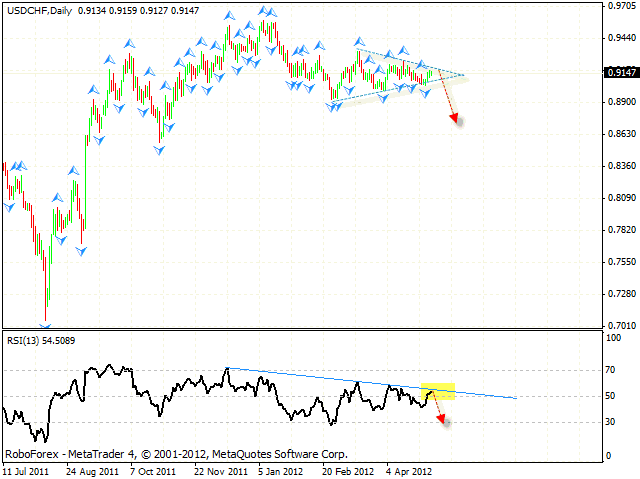
USD/CAD
At the H4 chart Canadian Dollar continues moving inside the descending channel, at the moment the price is testing the channel’s upper border. Also, here we have “head & shoulders” reversal pattern forming with the target in the area of 0.9750. The target of the descending pattern is the area of 0.9735. One can consider aggressive sales from the current levels with the stop above 0.9905 and increase the amount of positions only after the price breaks the level of 0.9825. If the pair breaks the upper border and leaves the descending channel, this scenario will be cancelled.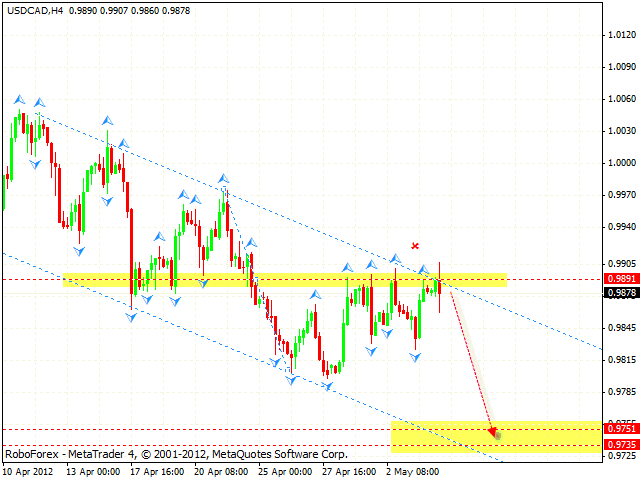
Attention!
Forecasts presented in this section only reflect the author’s private opinion and should not be considered as guidance for trading. RoboForex bears no responsibility for trading results based on trading recommendations described in these analytical reviews.