Bill Williams’ Indicators Analysis 13.05.2013 (USD/CAD, NZD/USD)
13.05.2013
Analysis for May 13th, 2013
USD/CAD
At the H4 chart of the USD/CAD currency pair, the Alligator is making a reverse upwards. The price completed a fractal above the Alligator’s mouth, and right now is forming a bearish one; the indicators are in the grey zone; there is a Squat bar on the MFI. I’m planning to place a limit buy order as soon as the price reached the Alligator’s teeth.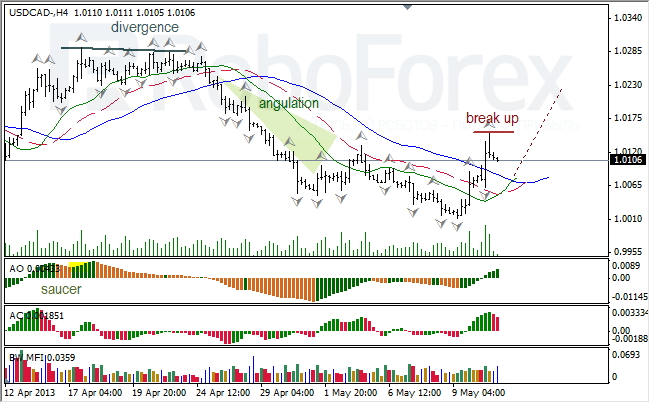
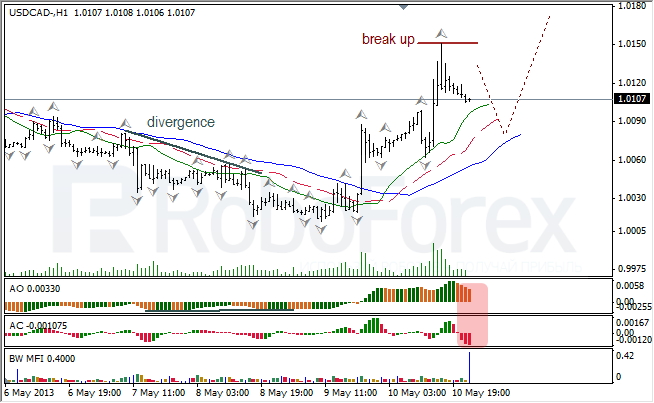
At the H1 chart of the USD/CAD currency pair, the Alligator is moving upwards. AO and AC indicators are in the red zone; there might be a Squat bar on the MFI. At this timeframe, bearish fractal may reach the Alligator’s jaw.
NZD/USD
At the H4 chart of the NZD/USD currency pair, the Alligator is opening its mouth downwards. The angle of angulation is open; the price completed a bearish fractal; AO and AC indicators are in the grey zone; there are two Squat bars in a row on the MFI. I’m staying out of the market until the price finishes a bullish fractal.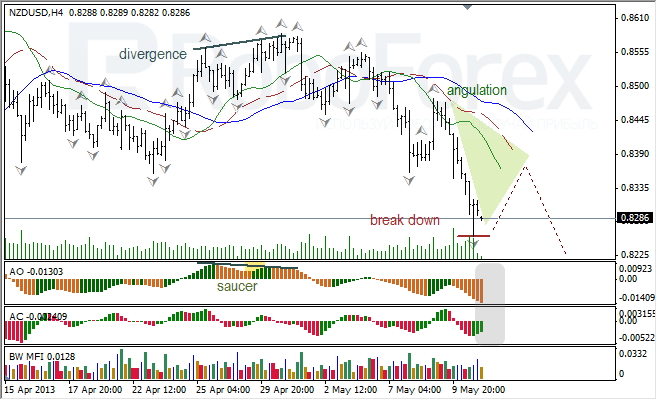
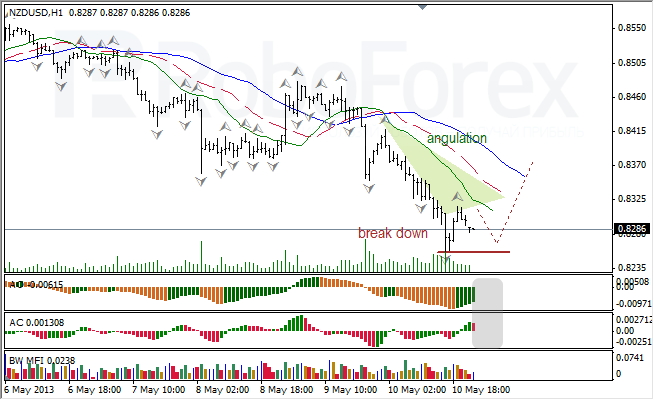
At the H1 chart of the NZD/USD currency pair, the Alligator is moving downwards. The angle of angulation is closing; the price is forming a new bearish fractal; AO and AC indicators are in the grey zone, so the fractal is quite unlikely to break the minimum. There is a Fade bar on the MFI; however, there might be a Squat one too. A bullish fractal may reach the Alligator’s jaw.
RoboForex Analytical Department
Attention!
Forecasts presented in this section only reflect the author’s private opinion and should not be considered as guidance for trading. RoboForex bears no responsibility for trading results based on trading recommendations described in these analytical reviews.