Bill Williams’ Indicators Analysis 20.05.2013 (USD/CAD, NZD/USD)
20.05.2013
Analysis for May 20th, 2013
USD/CAD
At the H4 chart of the USD/CAD currency pair, the Alligator is moving upwards. The price is forming a bearish fractal; AO and AC indicators are in the grey zone; there is a Squat bar on the MFI. I’m keeping my buy order; a protective stop is in the black.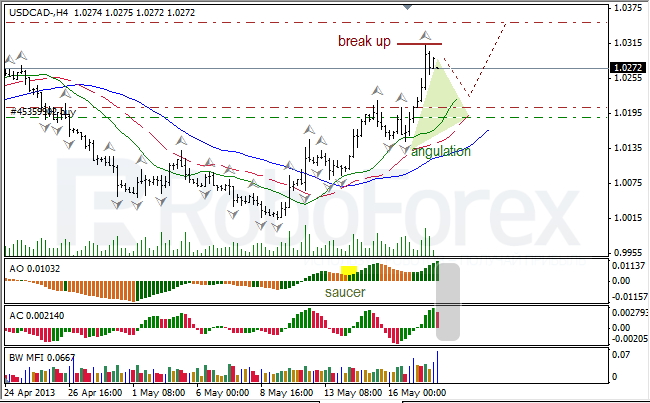
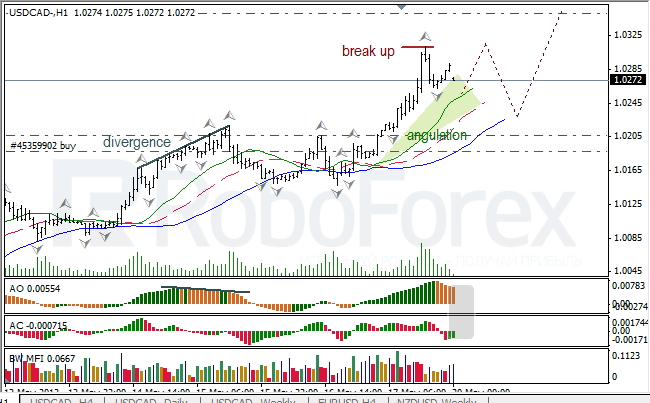
At the H1 chart of the USD/CAD currency pair, the Alligator woke up and is also moving upwards. The angle of angulation is open; AO and AC indicators are in the grey zone; there is a Squat bar on the MFI. I opened a buy order with the target above a bullish fractal; Take Profit is at the level of 1.0350.
NZD/USD
At the H4 chart of the NZD/USD currency pair, the Alligator is moving downwards. The price is forming a bearish fractal; after Inverted Saucer pattern on AO, the indicators entered the green zone; there is a Squat bar on the MFI. I’m staying out of the market until the price forms a bullish fractal.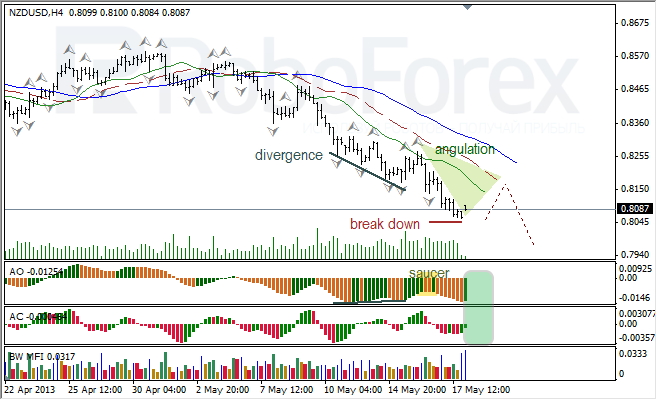
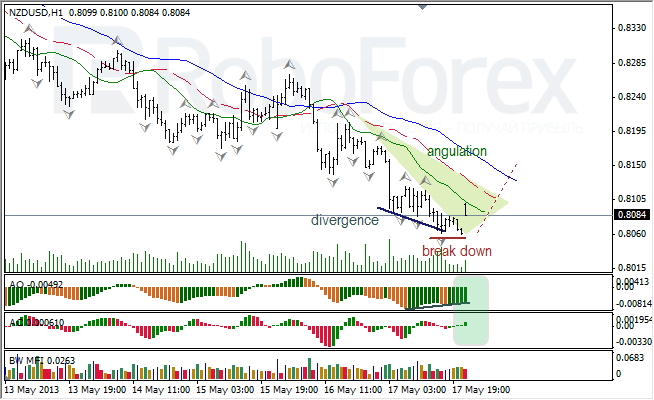
At the H1 chart of the NZD/USD currency pair, the Alligator is moving downwards. The angle of angulation is open; AO and AC indicators are in the green zone; there is a Fade bar on the MFI. A divergence may cause the price to move past the Alligator’s jaw.
RoboForex Analytical Department
Attention!
Forecasts presented in this section only reflect the author’s private opinion and should not be considered as guidance for trading. RoboForex bears no responsibility for trading results based on trading recommendations described in these analytical reviews.