Wave Analysis 16.02.2012 (NZD/USD, EUR/USD)
16.02.2012
Analysis for February 16th, 2012
NZD/USD
It looks like a rising impulse in wave C has been already completed, and right now the price is starting to form an initial descending impulse. In the near term, we can expect the price to continue moving downwards.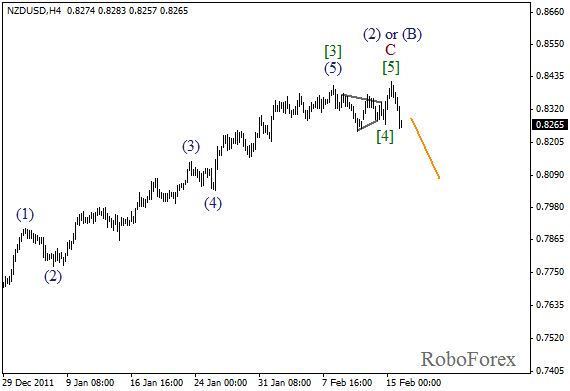
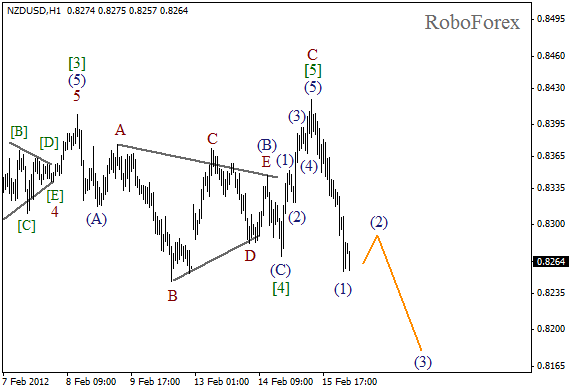
More detailed wave structure is shown on the H1 chart. Wave [4] has taken the form of zigzag pattern with a long triangle pattern inside wave (B). We may assume that the price has formed a bearish impulse in wave (1). After the local correction is finished we can expect the pair to continue falling down in wave (3).
EUR/USD
It looks like the pattern, which has been formed in wave 1, is wedge pattern indeed, and currently the market is moving downwards inside the third wave. The bears have broken the maximum of wave (B) and right now it’s quite obvious that Euro is going to continue falling down. The forecast for the next several days is negative.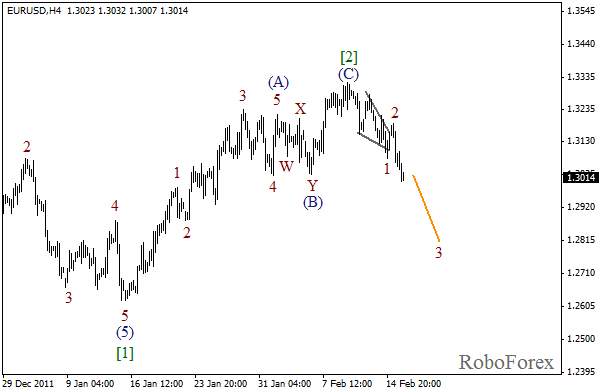
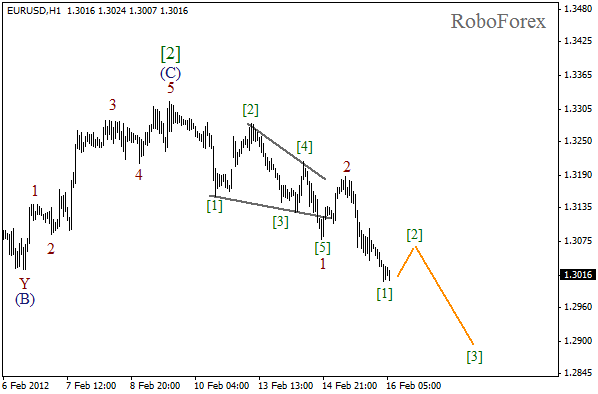
At the H1 chart the price completed wave 2 and then finished an initial impulse inside the third one. Most likely, the local correction will take place during the day. In the future we can expect the price to start falling down while forming wave [3].
Attention!
Forecasts presented in this section only reflect the author’s private opinion and should not be considered as guidance for trading. RoboForex bears no responsibility for trading results based on trading recommendations described in these analytical reviews.