Wave Analysis 18.02.2014 (DJIA Index, Crude Oil)
18.02.2014
Analysis for February 18th, 2014
DJIA Index
Index is about to start new ascending movement. At h4 chart, price formed two initial ascending impulses. After short local correction, instrument is expected to start forming the third wave.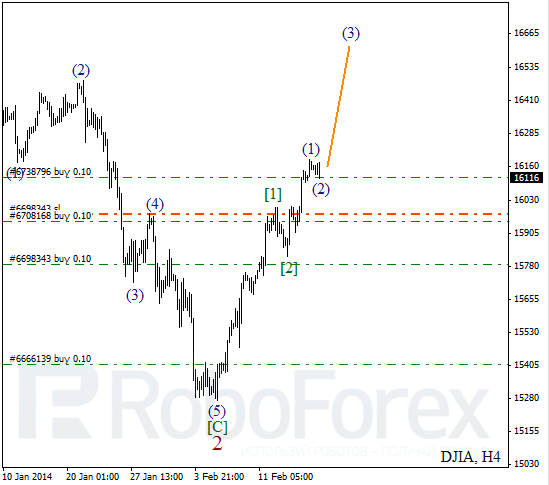
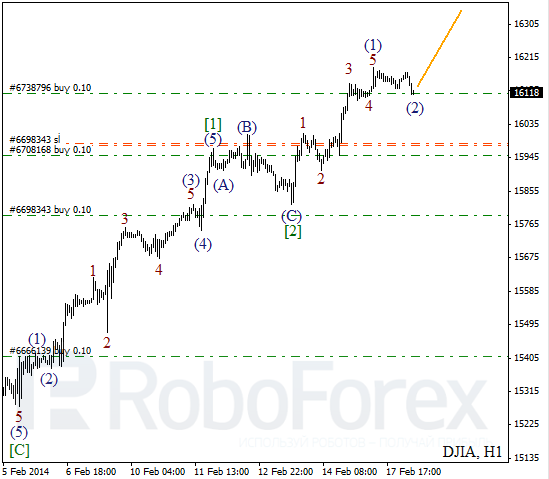
More detailed wave structure is shown on H1 chart. After completing impulse inside wave (1), Index started forming the second wave. Possibly, instrument may break maximum during the day.
Crude Oil
Probably, Oil finished wave [B] in the form of double three pattern. On minor wave level, wave (Y) took the form of zigzag pattern. In the nearest future, instrument is expected to move downwards inside wave 1.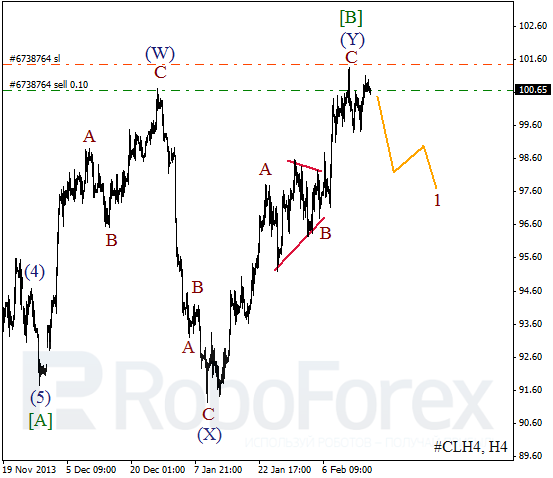
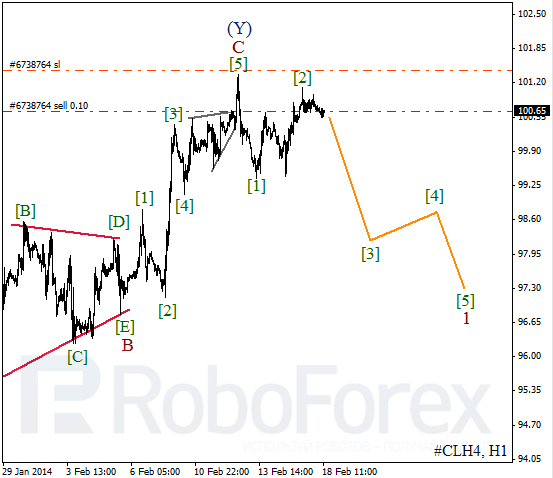
As we can see at the H1 chart, Probably, after finishing diagonal triangle pattern inside wave [5], market formed initial descending impulse. After local correction, instrument is expected to start moving downwards inside the third wave.
RoboForex Analytical Department
Attention!
Forecasts presented in this section only reflect the author’s private opinion and should not be considered as guidance for trading. RoboForex bears no responsibility for trading results based on trading recommendations described in these analytical reviews.