Wave Analysis 12.03.2012 (NZD/USD, EUR/USD)
12.03.2012
Analysis for March 12th, 2012
NZD/USD
The pair continues forming horizontal triangle pattern in wave [4]. It looks like the price completed an initial descending impulse and wave [2]. We can’t exclude a possibility that the market may be already moving inside the third wave. The forecast for the next several days remains bearish.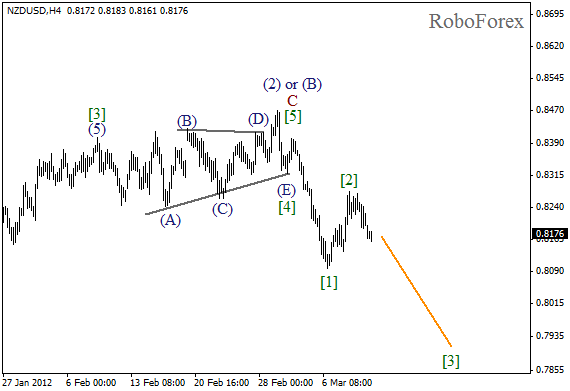
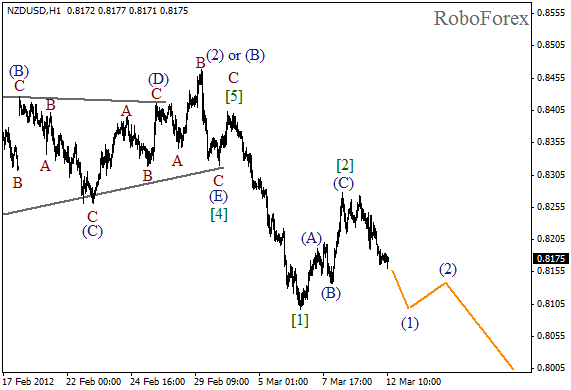
More detailed wave structure is shown on the H1 chart. We may assume that the price completed zigzag pattern inside the second wave and currently is forming initial wave (1) inside the third one. If the pair continues moving this way, the price may reach a new local minimum within the next several days.
EUR/USD
On Friday Euro moved downwards, thus starting the formation of the third wave. The price has already reached a new local minimum. Most likely, the pair will continue moving downwards during this week. The target for the next several days is the level of 1.2900.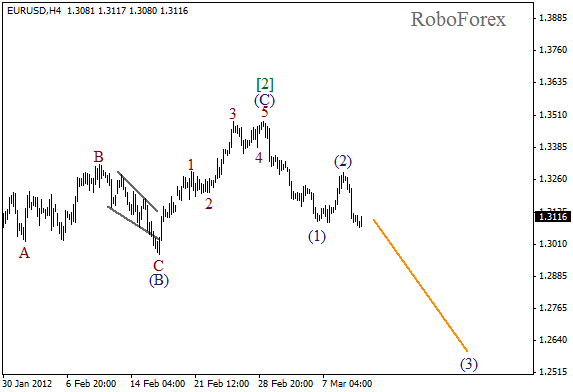
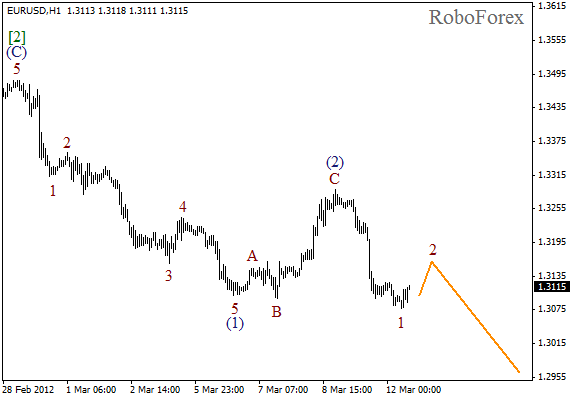
If we take a look at more detailed wave structure, which is shown on the H1 chart, we can see that wave (2) has been completed in the form of flat pattern. On the minor wave level the price finished a bearish impulse. Currently the local correction is taking place, and after it is finished we can expect the price to start falling down again.
Attention!
Forecasts presented in this section only reflect the author’s private opinion and should not be considered as guidance for trading. RoboForex bears no responsibility for trading results based on trading recommendations described in these analytical reviews.