Wave Analysis 24.03.2012 (NZD/USD, EUR/USD)
24.03.2012
Weekly Analysis, March 24th, 2012
NZD/USD
At the daily chart of the pair the price formed a descending wedge pattern, which may be both, the first wave and wave (A). We may assume that the correction was completed in the form of zigzag pattern with an extension in wave C, and right now the price is forming a descending impulse in wave 1. We can expect the pair to continue moving downwards during the next several weeks.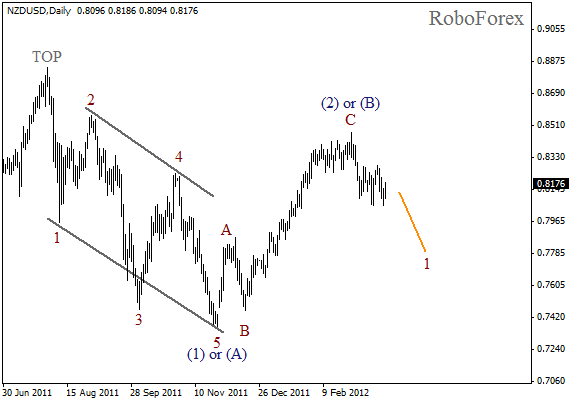
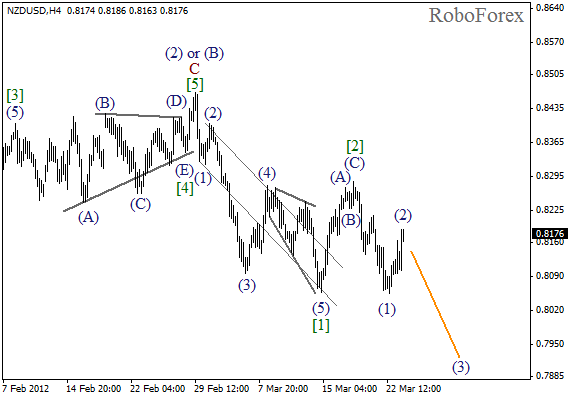
At the H4 chart the price formed two initial bearish impulses at once. On the minor wave level we can see that wave (2) is about to be completed. Next week we can expect the price to start falling down again while forming the third wave.
EUR/USD
It looks like the price, after completing horizontal triangle pattern in wave [X], is forming a descending wedge pattern in wave (A). On the minor wave level the fourth wave has been finished and right now we can see the formation of the fifth one. Most likely, the price will continue moving downwards inside wave 5 of (A) during the next several weeks.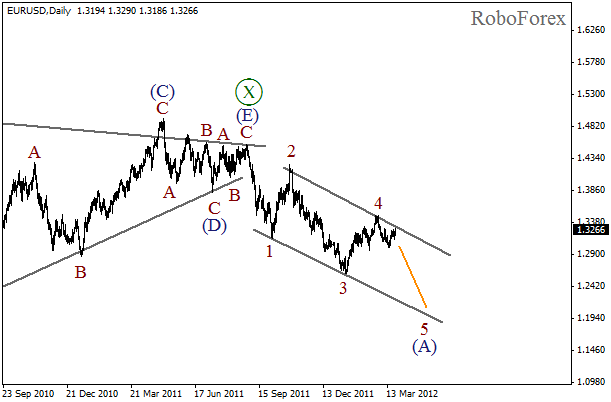
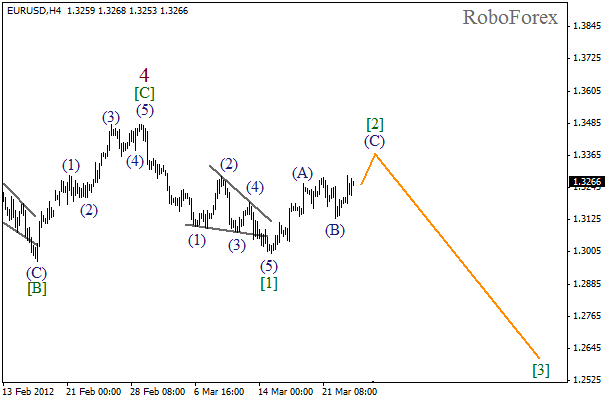
After completing zigzag pattern in wave 4, the price has finished a descending wedge pattern in wave [1]. Currently the pair is finishing the formation of the second wave in the form of a usual zigzag pattern. Next week we can expect the price to start falling down again while forming the third wave.
Attention!
Forecasts presented in this section only reflect the author’s private opinion and should not be considered as guidance for trading. RoboForex bears no responsibility for trading results based on trading recommendations described in these analytical reviews.