Wave Analysis 26.03.2014 (DJIA Index, Crude Oil)
26.03.2014
Analysis for March 26th, 2014
DJIA Index
Index is still being corrected. My sell order is a bit in drawdown, but price is expected to complete wave (B) quite soon. Most likely, in the nearest future market will start falling inside wave (C) of [2].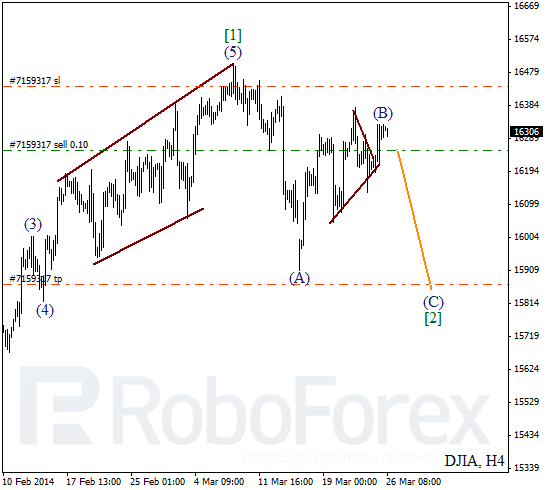
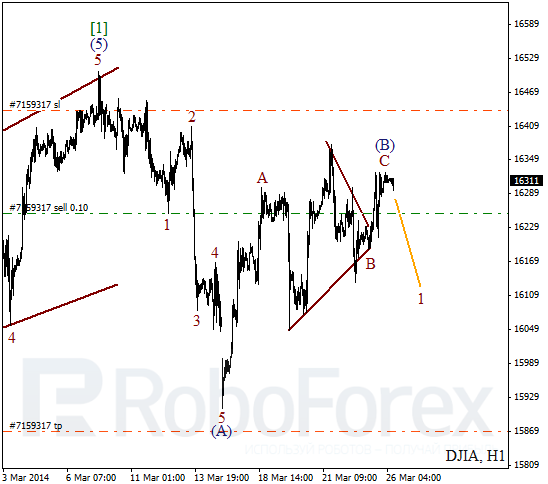
More detailed wave structure is shown on H1 chart. It looks like price formed diagonal triangle pattern inside wave B. Current chart structure implies that Index finished impulse inside wave C. in the near term, instrument is expected to start falling down inside wave 1.
Crude Oil
I’m keeping my sell order. It looks like Oil completed wave 2 and is about to start new descending movement inside the third one. Possibly, price may break minimum of wave 1 until the end of this week.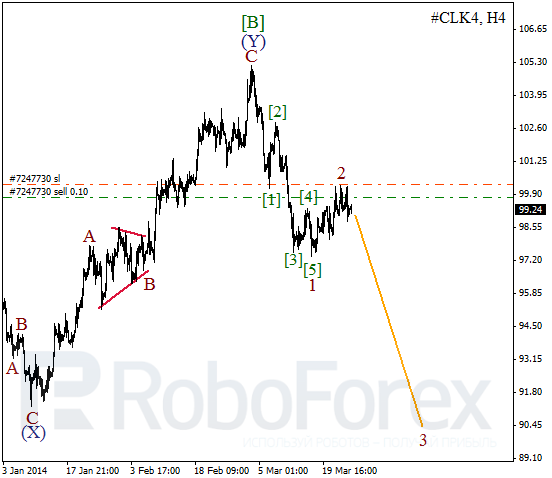
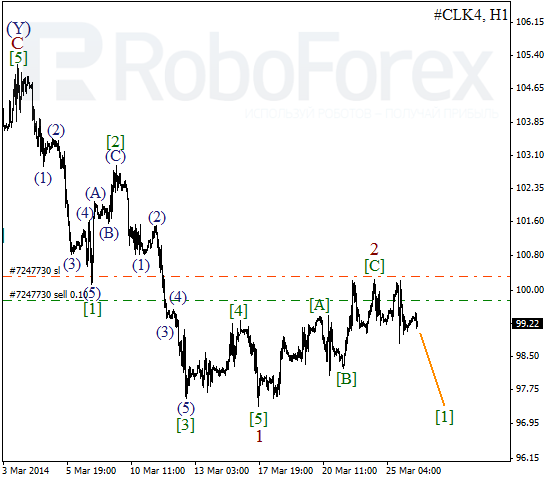
As we can see at the H1 chart, wave 2 took the form of zigzag pattern. On minor wave level, market is forming bearish impulse. Price is expected to continue falling down during Wednesday.
RoboForex Analytical Department
Attention!
Forecasts presented in this section only reflect the author’s private opinion and should not be considered as guidance for trading. RoboForex bears no responsibility for trading results based on trading recommendations described in these analytical reviews.