Wave Analysis 04.04.2013 (DJIA Index, Crude Oil)
04.04.2013
Analysis for April 4th, 2013
DJIA Index
We can’t exclude a possibility that the Index is making a reverse. Yesterday the price rebounded from the maximum and I had time to open a sell order, the stop on which was already in the black. If the market continues falling down, I’ll open several more orders.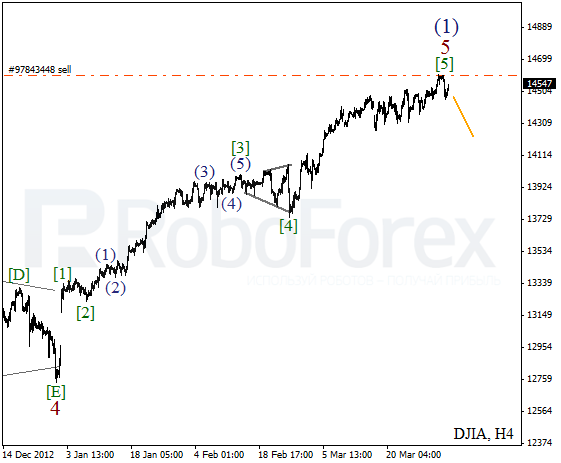
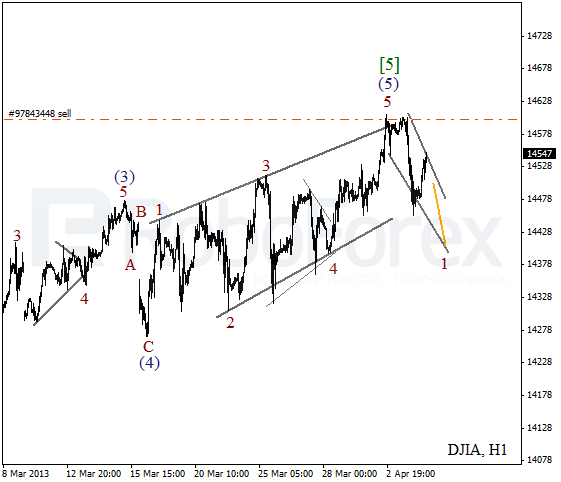
We can’t exclude a possibility that at the H1 chart the price formed diagonal triangle pattern inside wave (5). On the minor wave level the instrument is forming a descending wedge pattern inside the first wave. After a local correction, the Index is expected to start a new descending movement.
Crude Oil
The second wave turned out to be deeper than we expected. We can’t exclude a possibility that Oil may continue moving downwards up to end of this week, that’s why I opened a short-term sell order. However, later the instrument is expected to start growing up and form the third wave.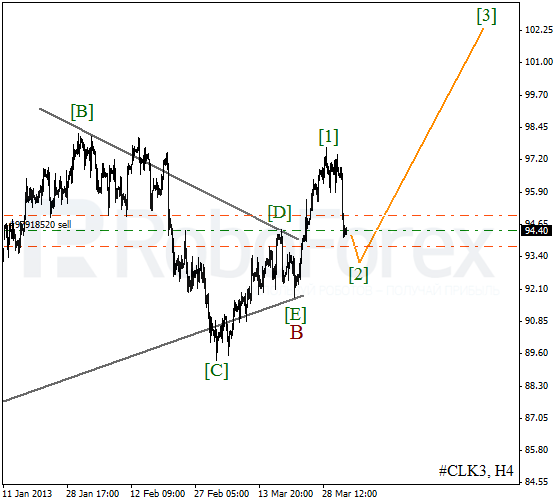
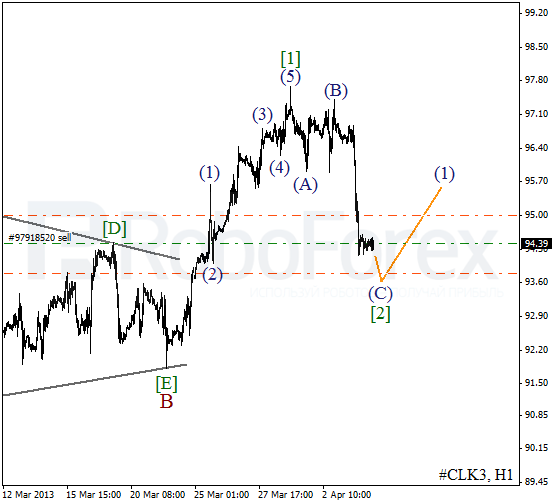
More detailed wave structure is shown on the H1 chart. Wave [2] is taking the form of zigzag pattern with an expanded wave (C) inside it. After a consolidation, Oil is expected to continue moving downwards inside the fifth wave.
RoboForex Analytical Department
Attention!
Forecasts presented in this section only reflect the author’s private opinion and should not be considered as guidance for trading. RoboForex bears no responsibility for trading results based on trading recommendations described in these analytical reviews.