Wave Analysis 27.04.2012 (NZD/USD, EUR/USD)
27.04.2012
Analysis for April 27th, 2012
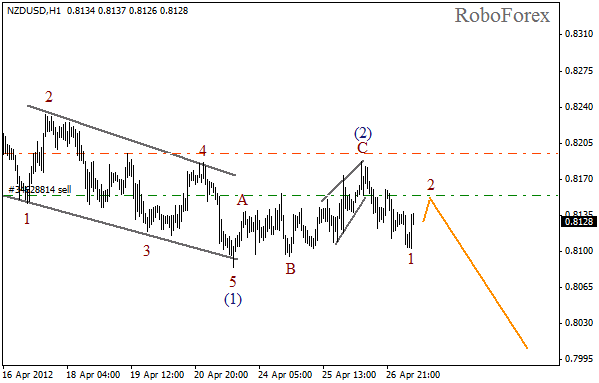
NZD/USD
We may assume that wave (2) has been completed and the market is going to start a significant descending movement inside the third wave. Yesterday I opened a sell order with the stop placed above the local maximum. I’ll move the stop into the black as soon as possible.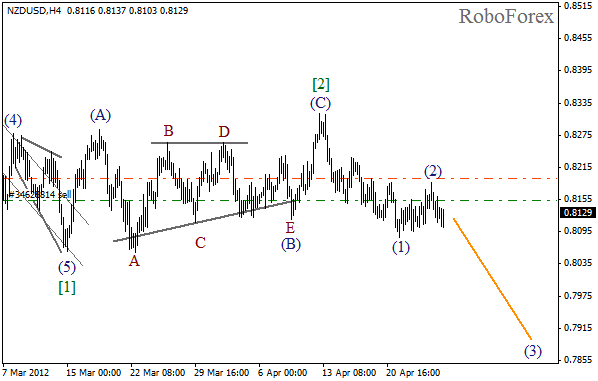
At the H1 chart of the pair the price has finished wave C of (2) in the form of diagonal triangle pattern and an initial descending impulse in wave 1. In the near term, we can expect a slight local correction and then the price may start falling down again.
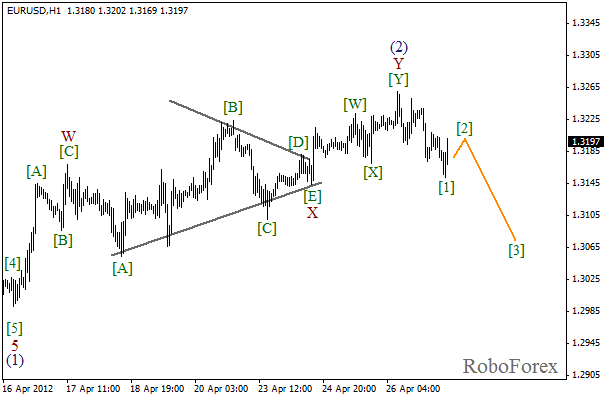
EUR/USD
It looks like a descending wedge pattern in wave (1) has been corrected by double zigzag pattern. The market is starting to move downwards slowly. During the next week the price may reach a new local minimum while forming the third wave.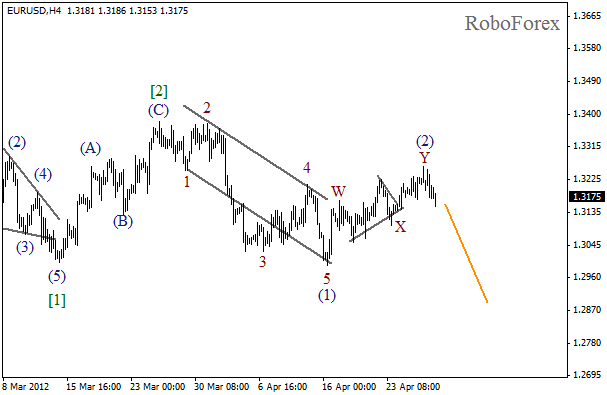
As we can see at the H1 chart, wave X has been completed in the form of horizontal triangle pattern. On the minor wave level the price has finished an initial impulse in wave [1]. After forming the second wave, the price will start moving downwards again.
Attention!
Forecasts presented in this section only reflect the author’s private opinion and should not be considered as guidance for trading. RoboForex bears no responsibility for trading results based on trading recommendations described in these analytical reviews.