Wave Analysis 05.06.2013 (DJIA Index, Crude Oil)
05.06.2013
Analysis for June 5th, 2013
DJIA Index
It looks like the Index is finishing the fourth wave; earlier the price formed an extension inside the third one. We can’t exclude a possibility that during the next several days the instrument may break historic maximum while forming wave [5] of 3.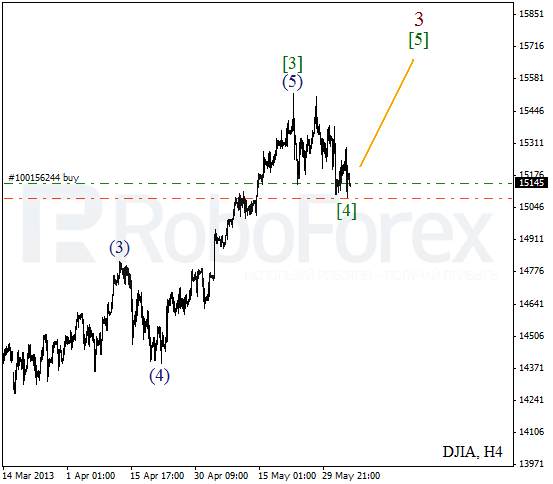
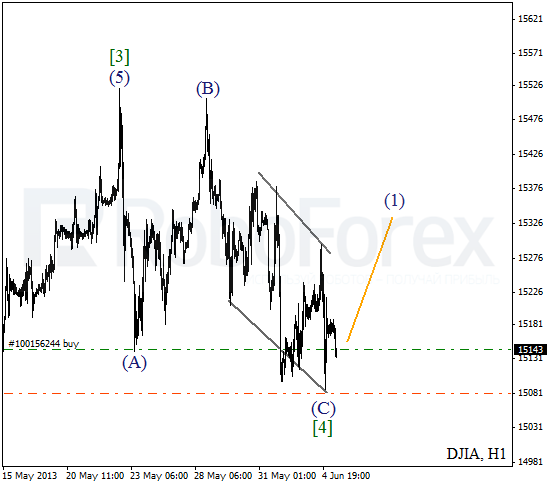
More detailed wave structure is shown on the H1 chart. Wave [4] is taking the form of zigzag pattern. On the minor wave level, the Index completed wave (C) in the form of diagonal triangle pattern. After formation of an initial ascending impulse, I opened a buy order with the stop near the minimum of the fourth wave.
Crude Oil
Oil is trying to start a new ascending movement. We may assume that the second wave was completed in the form of zigzag pattern, and right now, on the minor wave level, the price may is forming a bullish impulse. If this assumption is correct, then the instrument may continue growing up inside wave [1] during the day.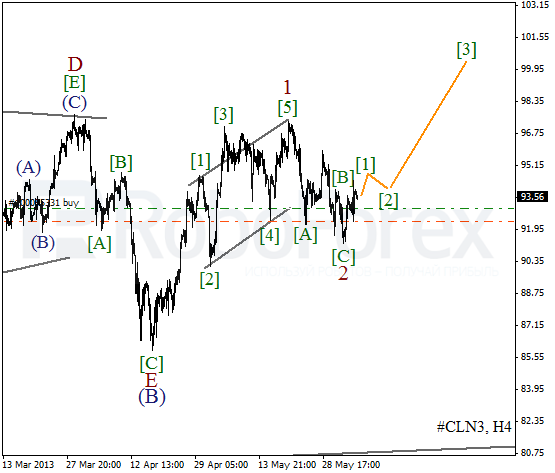
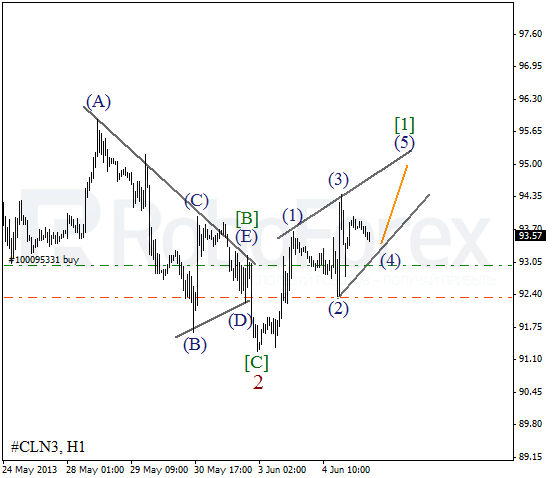
As we can see at the H1 chart, wave 2 was completed in the form of zigzag pattern with triangle inside wave [B]. Currently Oil is forming wedge pattern inside wave [1] with the fourth wave inside it. During the next several hours, the price is expected to start growing up inside wave (5) of [1].
RoboForex Analytical Department
Attention!
Forecasts presented in this section only reflect the author’s private opinion and should not be considered as guidance for trading. RoboForex bears no responsibility for trading results based on trading recommendations described in these analytical reviews.