Wave Analysis 02.08.2013 (DJIA Index, Crude Oil)
02.08.2013
Analysis for August 2nd, 2013
DJIA Index
Yesterday the Index reached a new maximum. It looks like right now the price is forming wave (5) of [5]. I’ve moved the stop on my buy order into the black. The market is expected to continue moving upwards.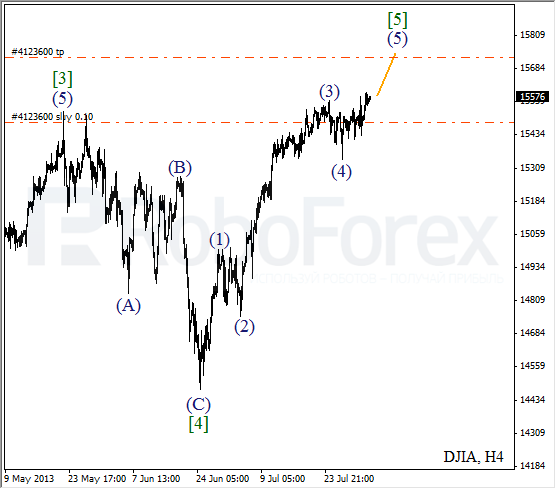
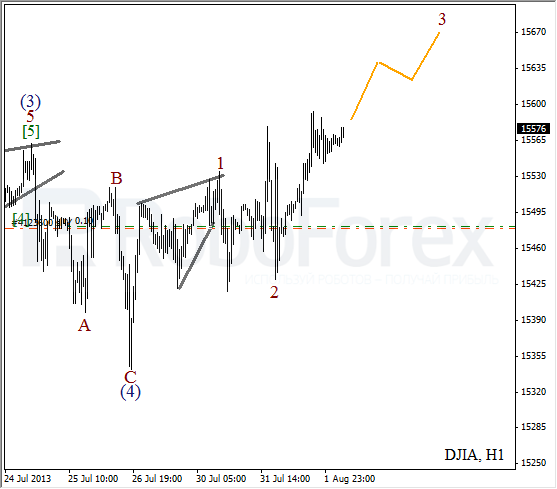
More detailed wave structure is shown on the H1 chart. After completing zigzag pattern inside wave (4), the price finished an initial wedge pattern. Wave 2 took the form of flat pattern. It looks like right now the instrument is forming an extension inside wave 3 of (5).
Crude Oil
Oil is moving upwards fast inside wave (5). Most likely, the price will break the maximum during the day. Later, after finishing the fifth wave, the instrument may start a deeper correction.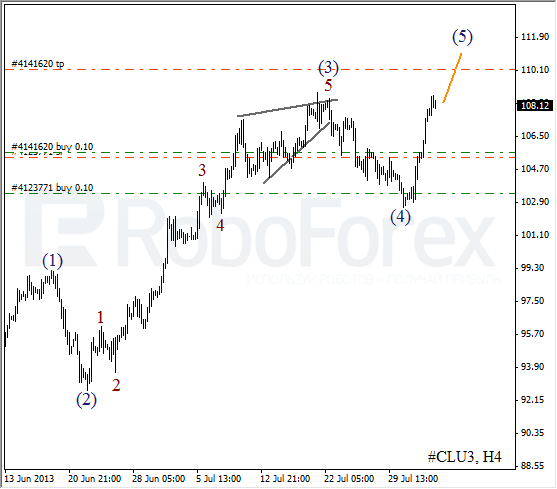
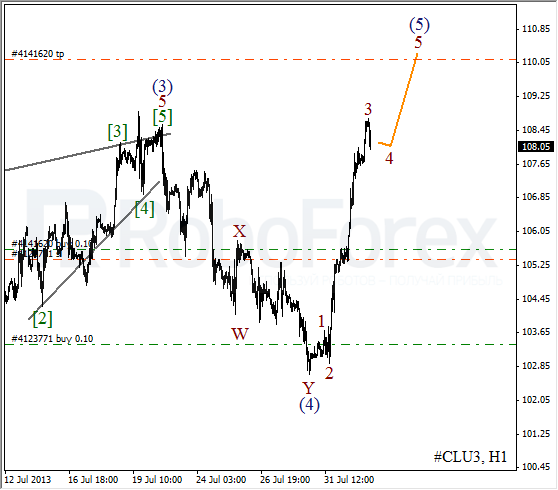
As we can see at the H1 chart, wave (4) took the form of doublezigzag pattern. Right now, the price is forming a bullish impulse inside wave (5). On the minor wave level, Oil started the fourth wave. After completing a local correction, the instrument is expected to start moving upwards inside wave 5 of (5).
RoboForex Analytical Department
Attention!
Forecasts presented in this section only reflect the author’s private opinion and should not be considered as guidance for trading. RoboForex bears no responsibility for trading results based on trading recommendations described in these analytical reviews.