Wave Analysis 02.09.2013 (DJIA Index, Crude Oil)
02.09.2013
Analysis for September 2nd, 2013
DJIA Index
The Index finished a bearish impulse inside wave [A] and right now, the market is being corrected. Later, after completing wave [B], the instrument is expected to start a new descending movement inside wave [C].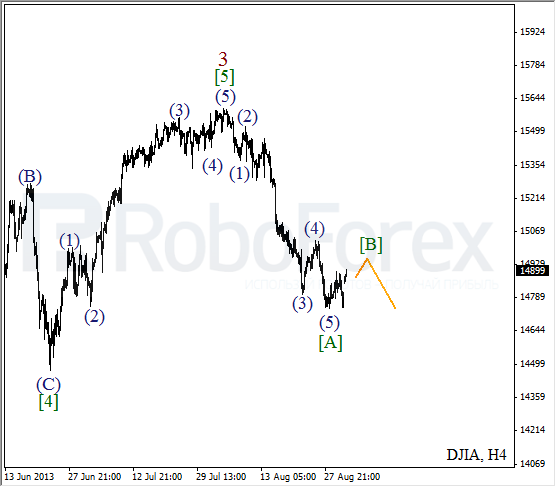
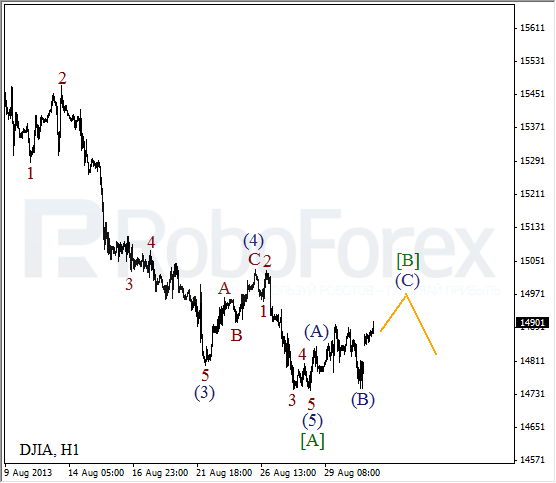
More detailed wave structure is shown on the H1 chart. We may assume that the Index is forming zigzag pattern inside wave [B]. In the near term, the price is expected to complete wave (C) and start forming an initial descending impulse.
Crude Oil
We can’t exclude a possibility that Oil formed skewed triangle pattern inside wave (4). On the minor wave level, the price completed wave E. During the next several days, the market may form a bullish impulse inside wave 1.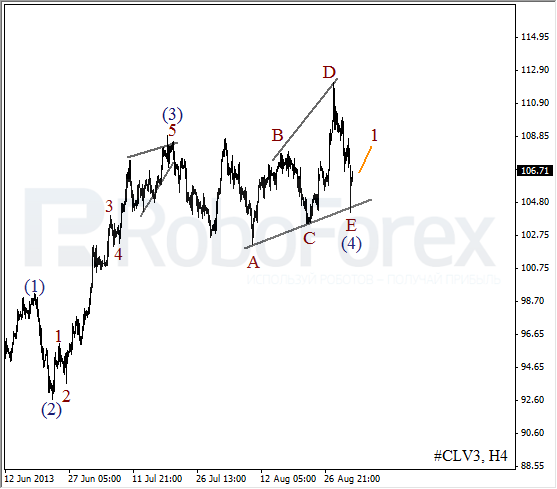
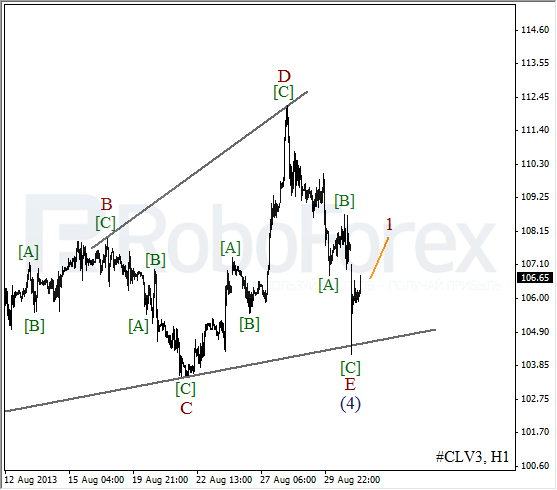
As we can see at the H1 chart, wave E took the form of zigzag pattern. The market rebounded from the triangle’s lower border. After the instrument completes in initial impulse and then starts a new correction, I’m planning to open long positions.
RoboForex Analytical Department
Attention!
Forecasts presented in this section only reflect the author’s private opinion and should not be considered as guidance for trading. RoboForex bears no responsibility for trading results based on trading recommendations described in these analytical reviews.