Wave Analysis 01.10.2013 (DJIA Index, Crude Oil)
01.10.2013
Analysis for October 1st, 2013
DJIA Index
The Index continues forming an ascending diagonal triangle pattern. We may assume that the market completed wave (4) and is about to start a new ascending movement inside the fifth one. I’m planning to open several buy orders as soon as the price starts forming an initial ascending impulse.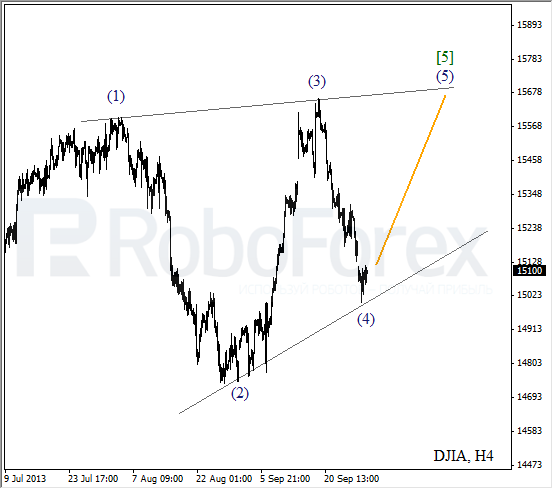
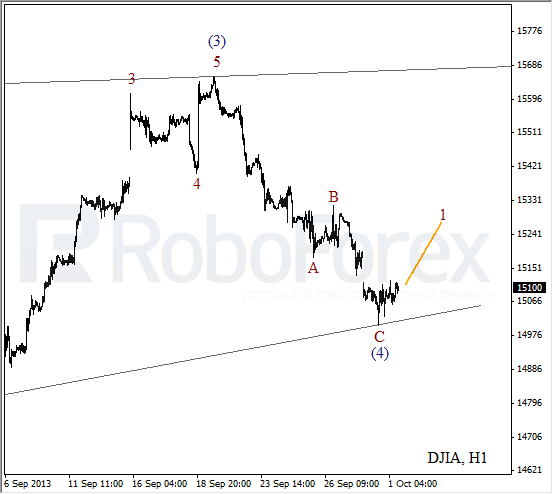
More detailed wave structure is shown on the H1 chart. Wave (4) is taking the form of zigzag pattern. The current chart structure implies that the price finished a short bearish impulse inside wave C. It looks like the market has already started forming the first wave.
Crude Oil
Oil is finishing double three pattern inside wave (4). The price may yet break the minimum, but later it is expected to make a reverse. After that, the instrument may start a new ascending movement inside wave 1.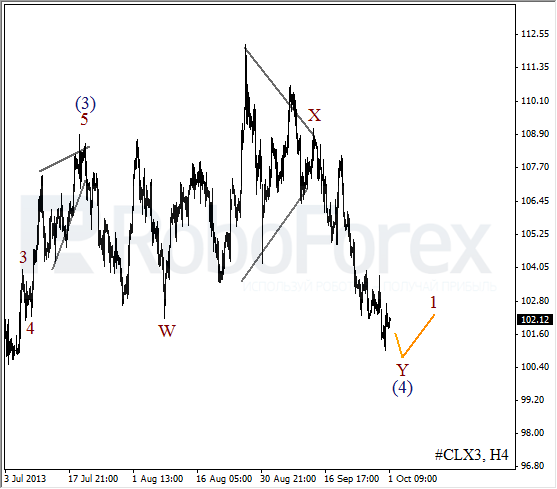
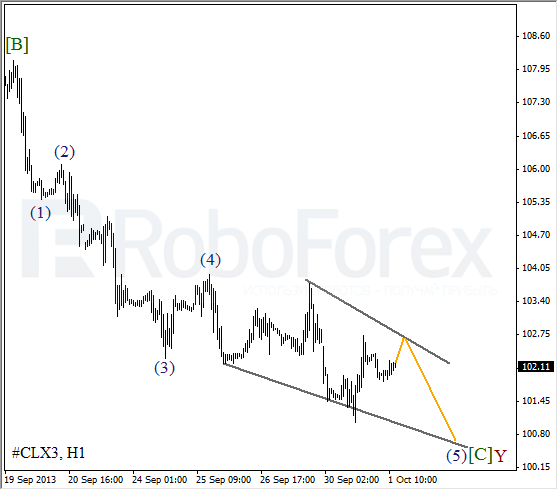
As we can see at the H1 chart, the price is forming is forming diagonal triangle pattern inside wave (5). On the minor wave level, the instrument is finishing the fourth wave. The price is expected to start the fifth wave during the day.
RoboForex Analytical Department
Attention!
Forecasts presented in this section only reflect the author’s private opinion and should not be considered as guidance for trading. RoboForex bears no responsibility for trading results based on trading recommendations described in these analytical reviews.