Wave Analysis 04.10.2012 (DJIA Index, Crude Oil)
04.10.2012
Analysis for October 4th, 2012
DJIA Index
We may assume that the price continues forming diagonal triangle pattern inside wave (5) of [1]. The market is still moving near the pattern’s lower border. If the price rebounds from the current levels, the instrument will start moving upwards.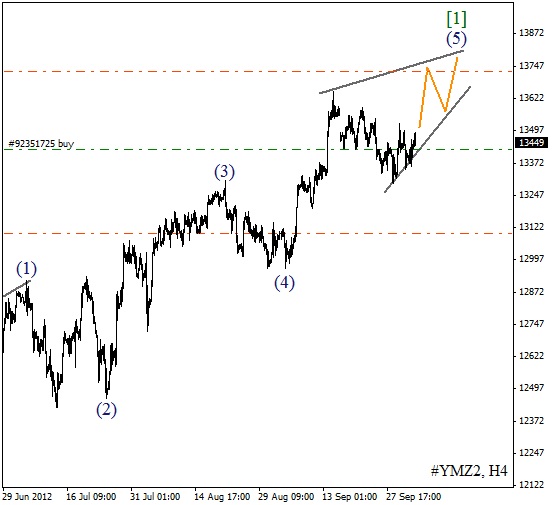
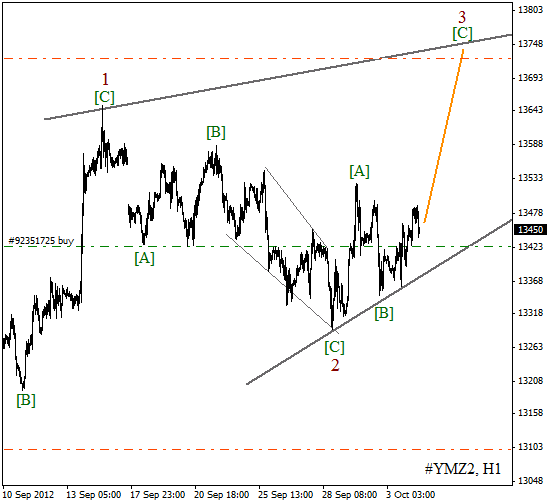
As we can see at the H1 chart, wave 2 has been completed with diagonal triangle pattern inside wave [C]. It looks like the price is starting to form wave [C] of 3. In the near term, the Index is expected to continue moving upwards and break a local maximum.
Crude Oil
Oil continues a corrective movement. We may assume that the price is forming zigzag pattern inside wave 2. On the minor wave level the instrument is completing wave [C]. During the next several days Oil is expected to finish the second wave and start growing up.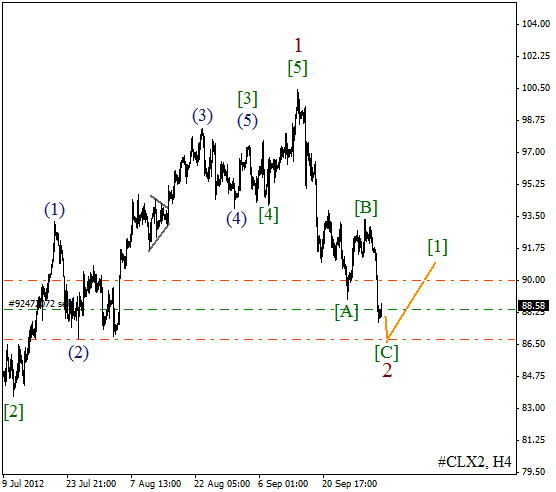
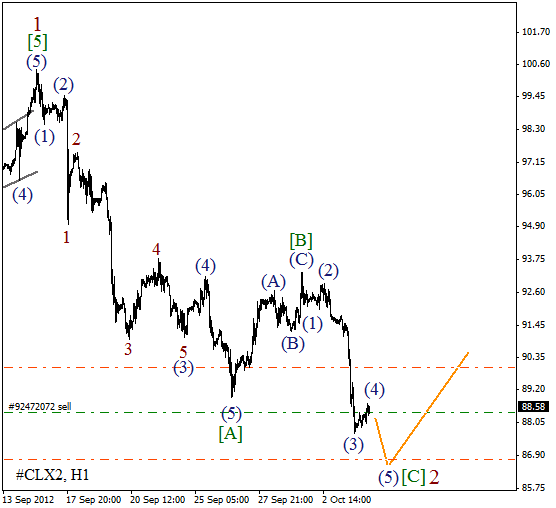
More detailed wave structure is shown on the H1 chart. We may assume that the price is forming the fourth wave inside wave [C]. During Thursday the instrument is expected to finish a local correction and continue moving downwards and form wave (5).
RoboForex Analytical Department
Attention!
Forecasts presented in this section only reflect the author’s private opinion and should not be considered as guidance for trading. RoboForex bears no responsibility for trading results based on trading recommendations described in these analytical reviews.