Wave Analysis 11.10.2013 (DJIA Index, Crude Oil)
11.10.2013
Analysis for October 11th, 2013
DJIA Index
The Index started a correction. It looks like the price formed a bearish impulse inside wave A. We can’t exclude a possibility that wave B may take the form of zigzag pattern with an ascending wave [A] inside it.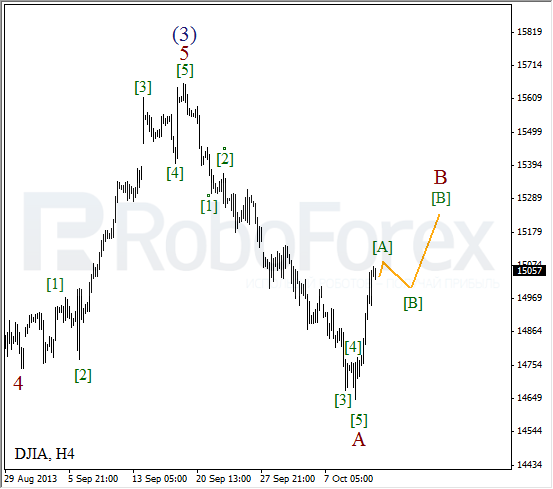
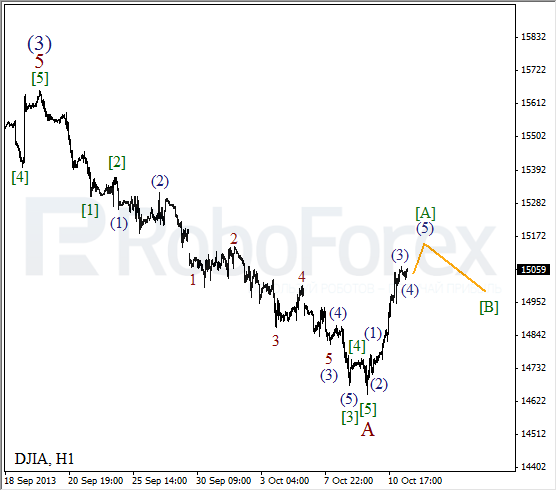
More detailed wave structure is shown on the H1 chart. The price is forming the fourth wave inside wave [A]. Most likely, after completing a local correction, the instrument will start moving upwards inside wave 5 of [A].
Crude Oil
Oil finished wave (4) in the form of double three pattern. We can’t exclude a possibility that the price has already formed several initial ascending impulses. Later, the instrument is expected to start growing up inside the third wave.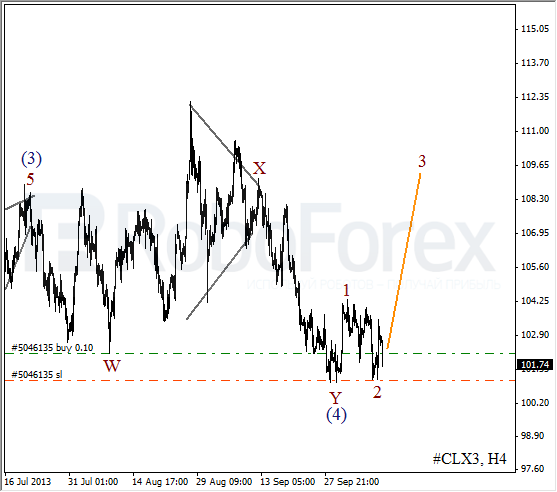
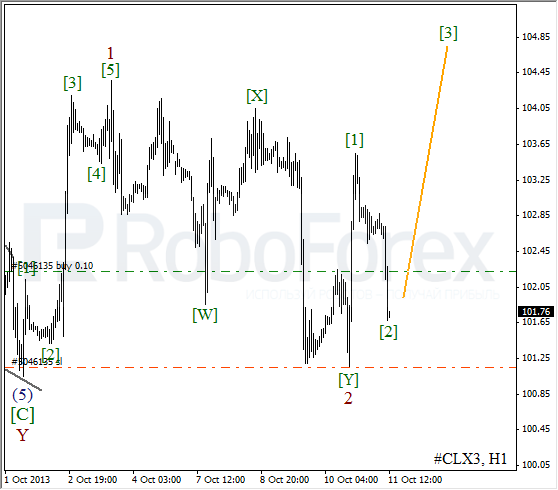
As we can see at the H1 chart, wave 2 was finished in the form of double zigzag pattern. On the minor wave level, the price formed a bullish impulse. After completing a local correction, the market may start moving upwards and forming wave [3].
RoboForex Analytical Department
Attention!
Forecasts presented in this section only reflect the author’s private opinion and should not be considered as guidance for trading. RoboForex bears no responsibility for trading results based on trading recommendations described in these analytical reviews.