Wave Analysis 22.10.2012 (DJIA Index, Crude Oil)
22.10.2012
Analysis for October 22nd, 2012
DJIA Index
We can’t exclude a possibility that the Index is still forming wave (1). A critical level here is the minimum of wave [4]. If the instrument breaks this level, we will have to reconsider the chart structure.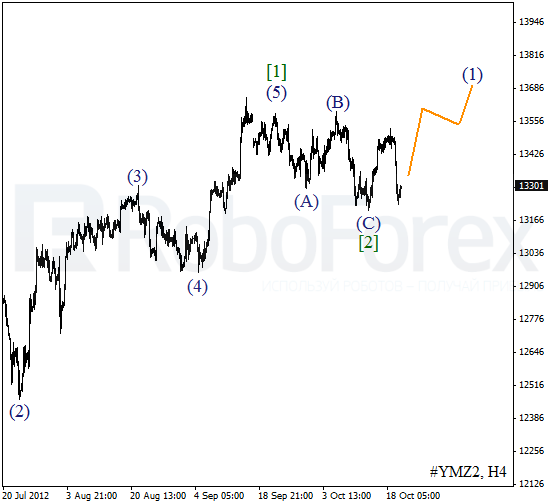
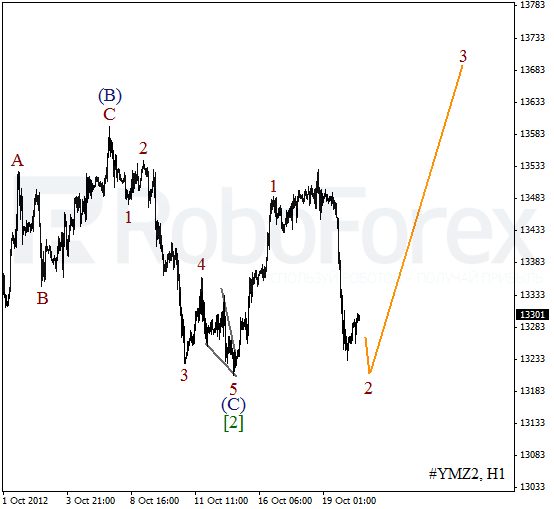
More detailed wave structure is shown on the H1 chart. We may assume that wave 2 is taking the form of flat pattern. The bears will most probably test a local minimum. If the price rebounds from it, we can expect the Index to start moving upwards inside the third wave.
Crude Oil
It looks like Oil continues a corrective movement. There is a possibility that the price may form a descending impulse inside wave [c] of 2 during the next several weeks. During the correction I’ve opened a short-term sell order with the target at the level of $86.50.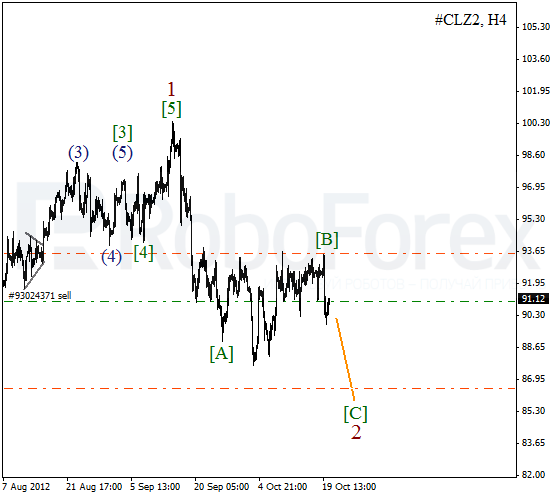
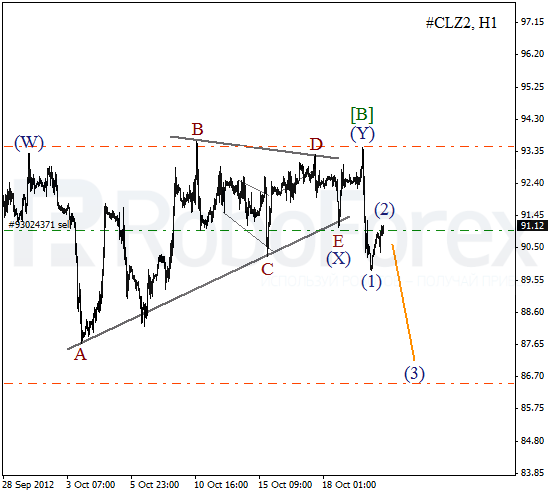
As we can see at the H1 chart, wave [B] took the form of double three pattern. On the minor wave level the price formed quite a large horizontal triangle pattern inside wave (X). We may assume the Oil is finishing wave (2) and may start falling down inside the third one during the next several hours.
RoboForex Analytical Department
Attention!
Forecasts presented in this section only reflect the author’s private opinion and should not be considered as guidance for trading. RoboForex bears no responsibility for trading results based on trading recommendations described in these analytical reviews.