Wave Analysis 23.10.2013 (DJIA Index, Crude Oil)
23.10.2013
Analysis for October 23rd, 2013
DJIA Index
It looks like the Index finished zigzag pattern inside wave B. On the minor wave level, the price completed diagonal triangle pattern inside wave [C]. During the next several days, the instrument may continue falling down.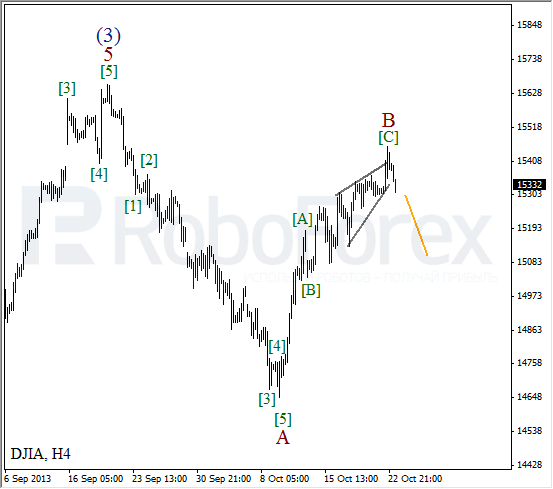
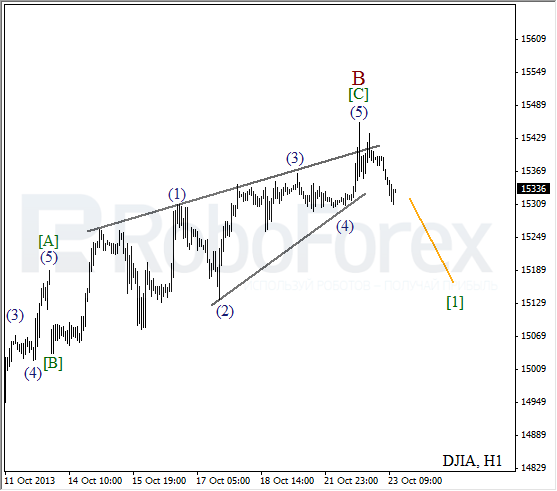
More detailed wave structure is shown on the H1 chart. We may assume that yesterday the price completed the fifth wave inside triangle pattern. The instrument has already broke its lower border and may reverse in the nearest future.
Crude Oil
It looks like Oil isn’t going to start any ascending movements, that’s why he have to change our scenario. There is a possibility that right now the instrument is forming a bearish impulse. The price may reach new minimums during the next couple of days.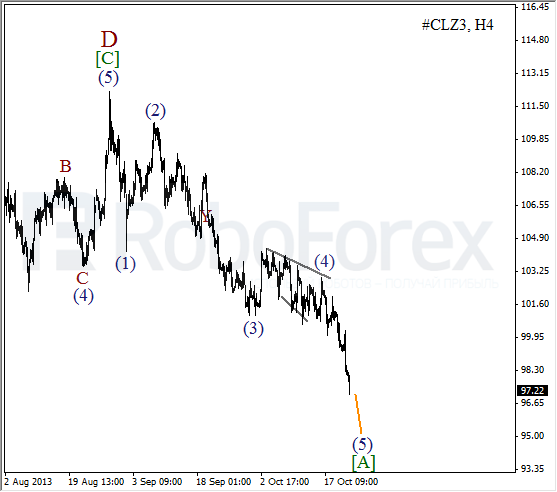
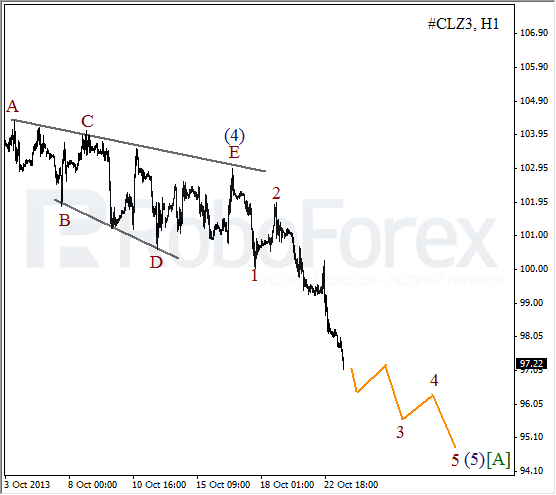
As we can see at the H1 chart, after completing triangle pattern inside wave (4), Oil is extending wave 3 of (5). During a correction, I’m planning to open sell orders.
RoboForex Analytical Department
Attention!
Forecasts presented in this section only reflect the author’s private opinion and should not be considered as guidance for trading. RoboForex bears no responsibility for trading results based on trading recommendations described in these analytical reviews.