Wave Analysis 26.10.2012 (DJIA Index, Crude Oil)
26.10.2012
Analysis for October 26th, 2012
DJIA Index
The Index continues a corrective movement. It looks like the price is forming double zigzag pattern inside wave [2]. Most likely, the instrument will continue moving downwards inside wave (Y).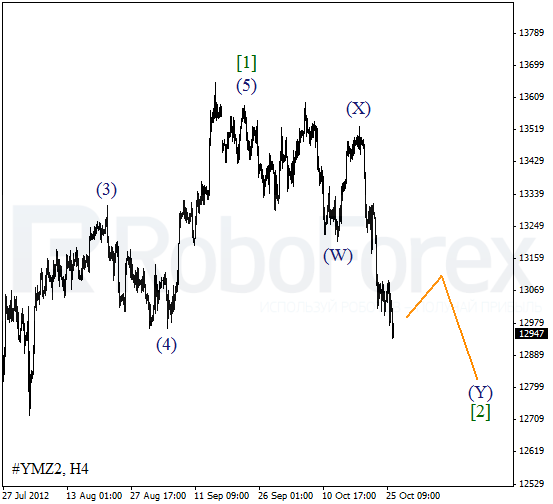
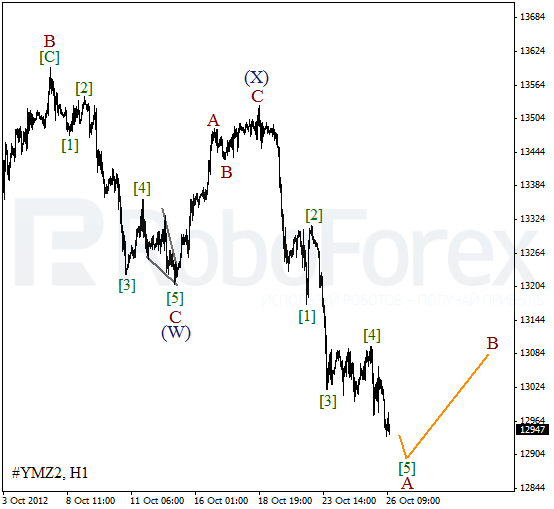
As we can see at the H1 chart, the price is forming a descending impulse inside wave A. On the minor wave level the Index is finishing the fifth wave. In the nearest future the instrument is expected to start forming a corrective wave B.
Crude Oil
Oil continues forming a descending zigzag pattern inside wave 2. Yesterday the price started falling down again and I moved the stop on my sell order into the black. Most likely, the price will break a local minimum during the day.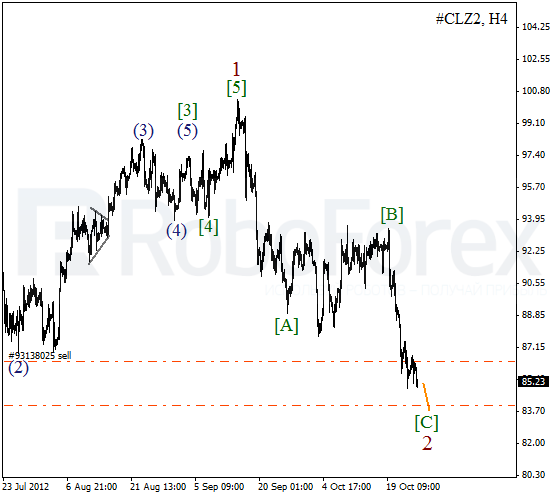
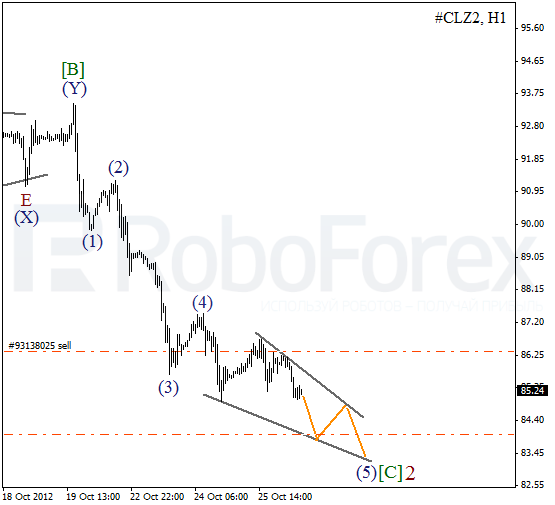
At the H1 chart we can see that Oil is forming an impulse inside wave [C]. On the minor wave level the price is forming diagonal triangle pattern inside the fifth wave. It looks like the market is going to continue falling down up to the level of $84 per barrel of Light Sweet
RoboForex Analytical Department
Attention!
Forecasts presented in this section only reflect the author’s private opinion and should not be considered as guidance for trading. RoboForex bears no responsibility for trading results based on trading recommendations described in these analytical reviews.