Wave Analysis 08.11.2012 (DJIA Index, Crude Oil)
08.11.2012
Analysis for November 8th, 2012
DJIA Index
Yesterday the Index reached a new local minimum. We may assume that the price completed forming double zigzag pattern inside wave [2]. In the nearest future we can expect the instrument to start forming an initial ascending impulse. A bit later I’m planning to open a buy order during a correction.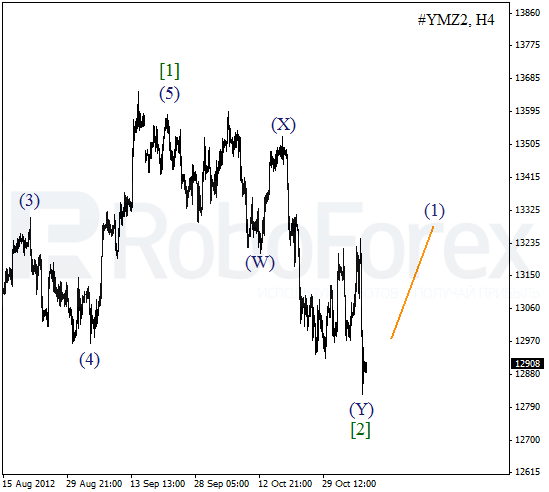
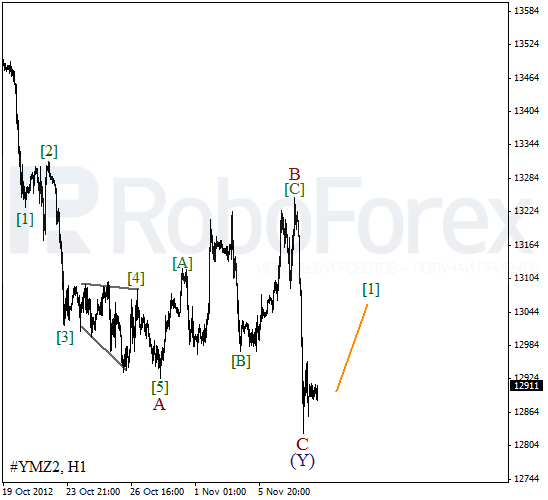
As we can see at the H1 chart, after completing zigzag pattern inside wave B, the price formed a descending impulse inside wave C of (Y). We can’t exclude a possibility that right now the Index is forming the first waves of a future ascending impulse. In the near term, the instrument is expected to move upwards inside wave [1].
Crude Oil
Against our expectation, yesterday the bears reached a new local minimum again. We may assume that the price formed zigzag pattern inside wave 2. Later Oil is expected to start forming an initial impulse inside wave [1], after which I’m planning to open a buy order.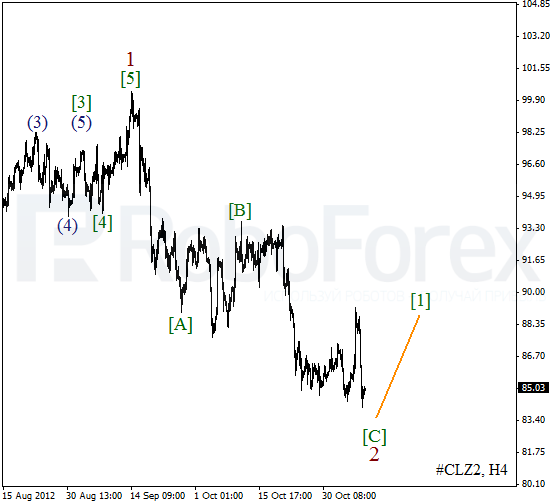
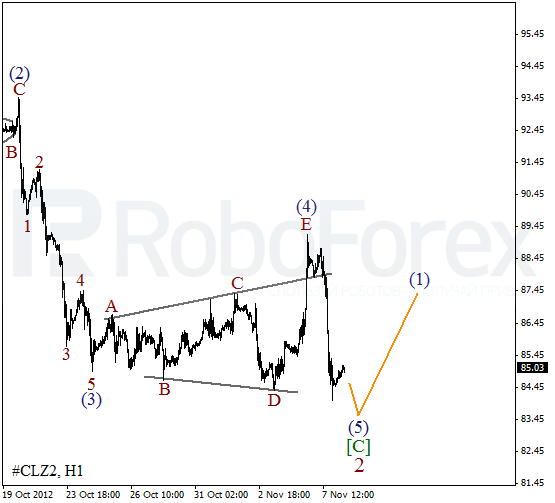
As we can see at the H1 chart, wave (4) took the form of divergent horizontal triangle pattern. The price needs one more descending wave to complete wave (5). Oil may reach a new local minimum during the day, however, after that we can expect the bulls to start pushing the price upwards and form wave (1).
RoboForex Analytical Department
Attention!
Forecasts presented in this section only reflect the author’s private opinion and should not be considered as guidance for trading. RoboForex bears no responsibility for trading results based on trading recommendations described in these analytical reviews.