Wave Analysis 20.11.2012 (DJIA Index, Crude Oil)
20.11.2012
Analysis for November 20th, 2012
DJIA Index
It looks like the Index is completing wave (2). Earlier the price formed a descending wedge pattern inside wave [1]. Most likely, the price will make a reverse in the nearest future and start forming a bearish wave (3).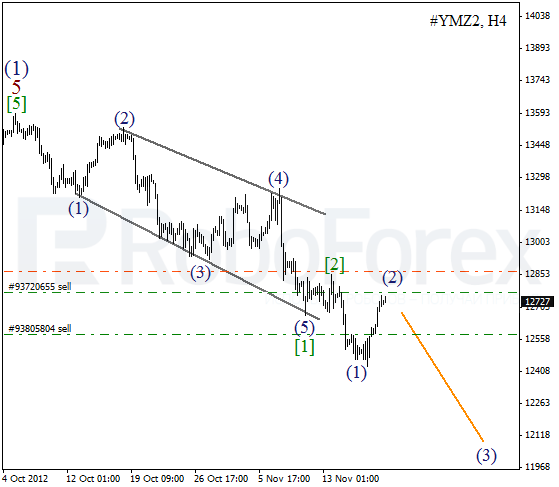
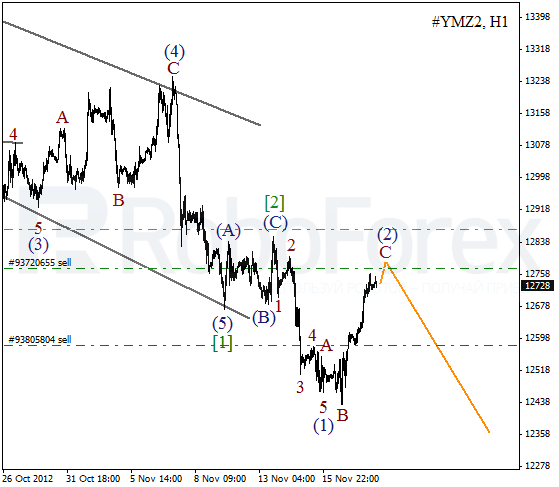
More detailed wave structure is shown on the H1 chart. It looks like at the moment the instrument is forming flat pattern inside wave (2). On the minor wave level the Index is growing up inside wave C. The bulls may reach a new local maximum during the day, but later price is expected to start a new descending movement.
Crude Oil
Oil continues forming wave (2). Earlier the price completed a descending wedge pattern inside the first wave. Most likely, the price will start a new descending movement inside wave (3) in the nearest future. However, considering quite a strong correction, which is taking place right now, I’ve decided to open only a sell order.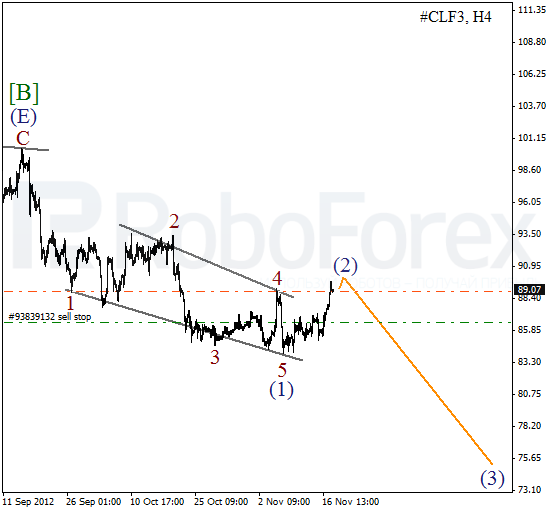
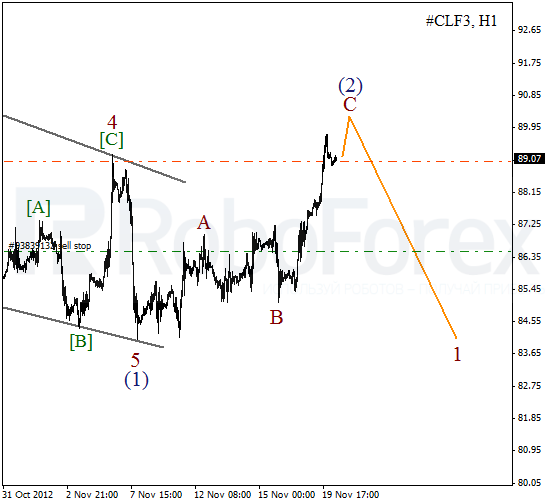
As we can see at the H1 chart, price is forming an ascending zigzag pattern with flat pattern inside wave B. Most likely, an impulse inside wave C will be finished very soon. In the near term, we can expect the instrument to make a reverse and start forming a bearish wave 1.
RoboForex Analytical Department
Attention!
Forecasts presented in this section only reflect the author’s private opinion and should not be considered as guidance for trading. RoboForex bears no responsibility for trading results based on trading recommendations described in these analytical reviews.