Wave Analysis 07.12.2012 (DJIA Index, Crude Oil)
07.12.2012
Analysis for December 7th, 2012
DJIA Index
It looks like a correction will take much more time than expected. Wave (B) was completed in the form of horizontal triangle pattern. During the next several days the Index may continue moving upwards a bit while forming wave (C) of [2].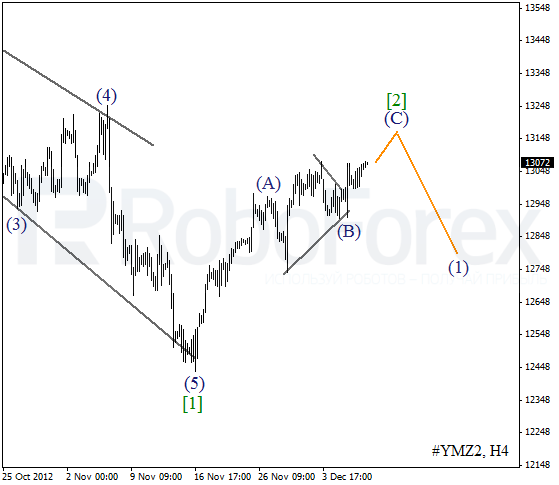
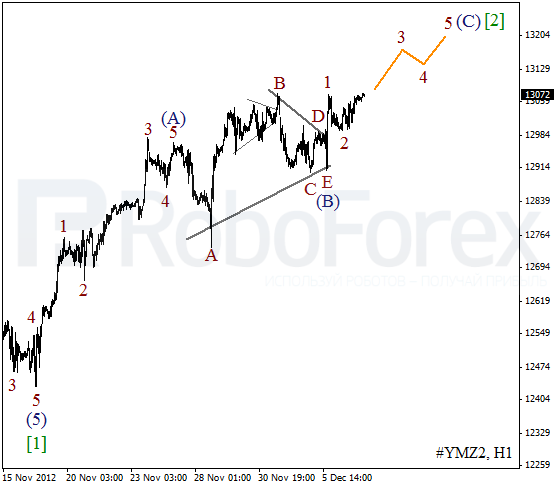
More detailed wave structure is shown on the H1 chart. Yesterday the instrument completed an initial impulse inside wave 1. Most likely, during Friday the Index will continue moving upwards and form wave 3 of (C).
Crude Oil
It looks like wave (2) was finished in the form of double zigzag pattern. Yesterday the bears were able to start pushing the price downwards again. Most likely, in the beginning of the next week the instrument will break the minimum of wave (1).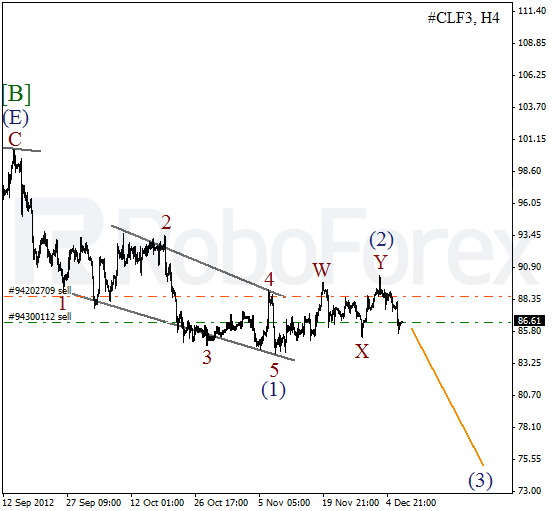
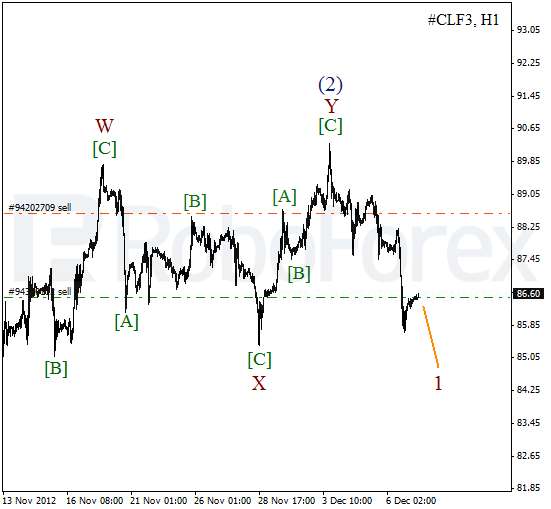
As we can see at the H1 chart, the price is forming an initial descending impulse. During a local correction I’ve decided to open one more sell order. The short-term target is at the level of $85 per barrel of Light Sweet.
RoboForex Analytical Department
Attention!
Forecasts presented in this section only reflect the author’s private opinion and should not be considered as guidance for trading. RoboForex bears no responsibility for trading results based on trading recommendations described in these analytical reviews.