Fibonacci Analysis: AUD/USD and USD/CAD, July 26, 2018
AUD/USD
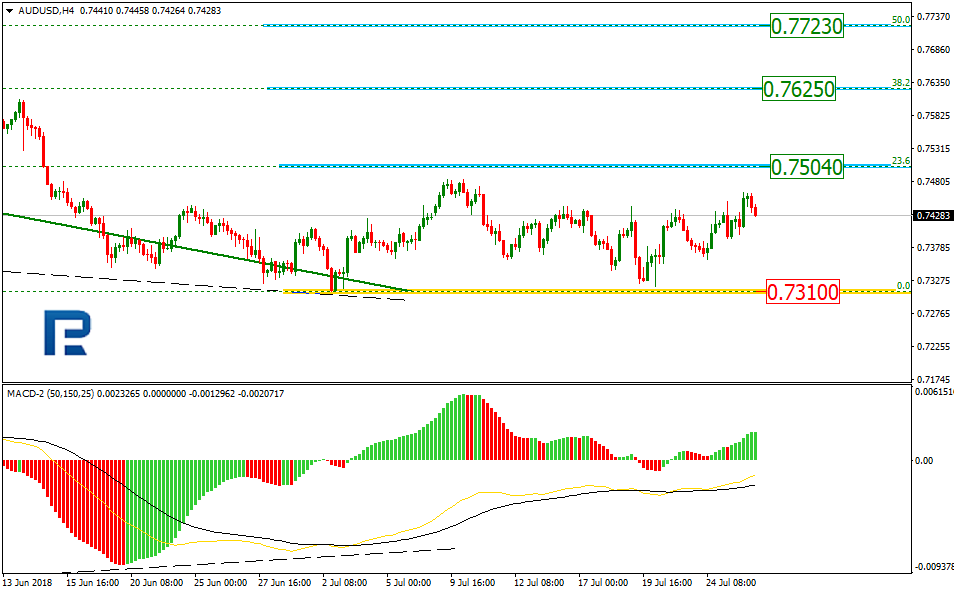
On H4, for AUD/USD we can see that the market is developing a flat correction trend. The targets of the correction growth are Fibonacci levels of 23.6% (0.7504), 38.2% (0.7625) and 50.0% (0.7723). With the current dynamics, the support is the minimum - 0.7310.

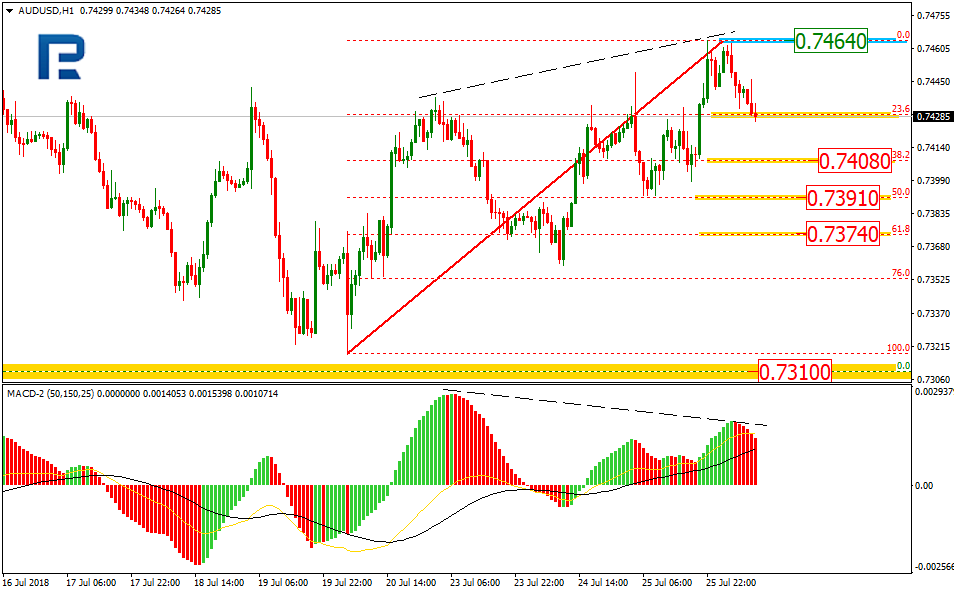
On H1, for AUD/USD we can see the beginning of a downward correction trend after the divergence. The correction has reached Fibonacci level of 23.6% and may continue developing until it reaches 38.2%-61.8%. The maximum of 0.7464 is the resistance.
USD/CAD
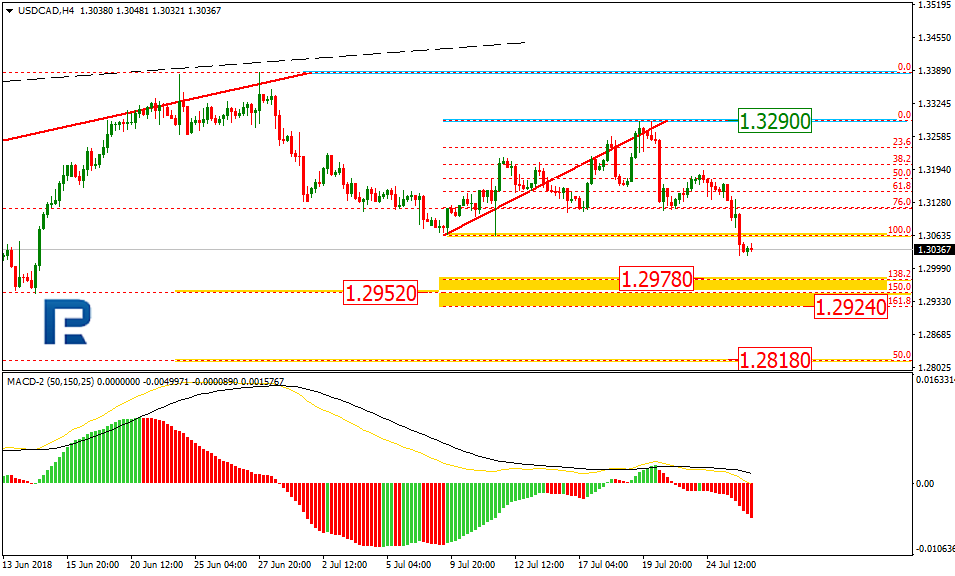
On H4, for USD/CAD we can see that the market has finished the local growth impulse and has continued the medium-term downtrend. Fibonacci Levels of 38.2% and 50.0% (1.2952 and 1.2818) may be the target levels for further descent.The level of 1.3290 is the resistance.
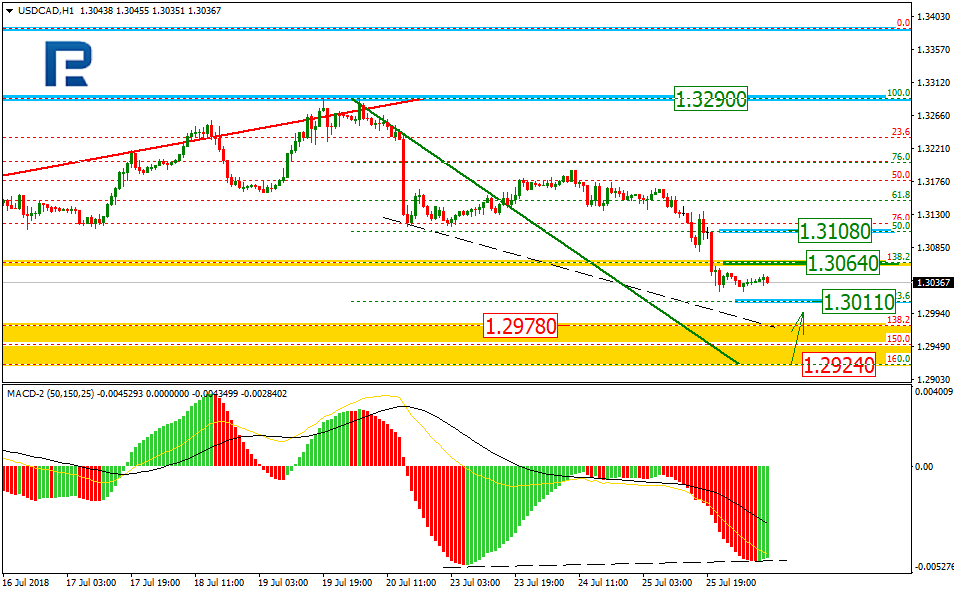
On H1, for USD/CAD we can see the downtrend directed at the post-correction extension range of 138.2-161.8% according to Fibonacci (1.2978-1.2924). Considering the development of convergence, we can assume the possibility of a pullback after the descent targets have been reached. The medium-term pullback targets may be the levels of 23.6% (1.3011), 38.2% (1.3064) and 50.0% (1.3108).
Forecasts presented in this section only reflect the author’s private opinion and should not be considered as guidance for trading. RoboForex bears no responsibility for trading results based on trading recommendations described in these analytical reviews.