Fibonacci Retracements Analysis 03.02.2022 (Brent, Dow Jones)
Brent
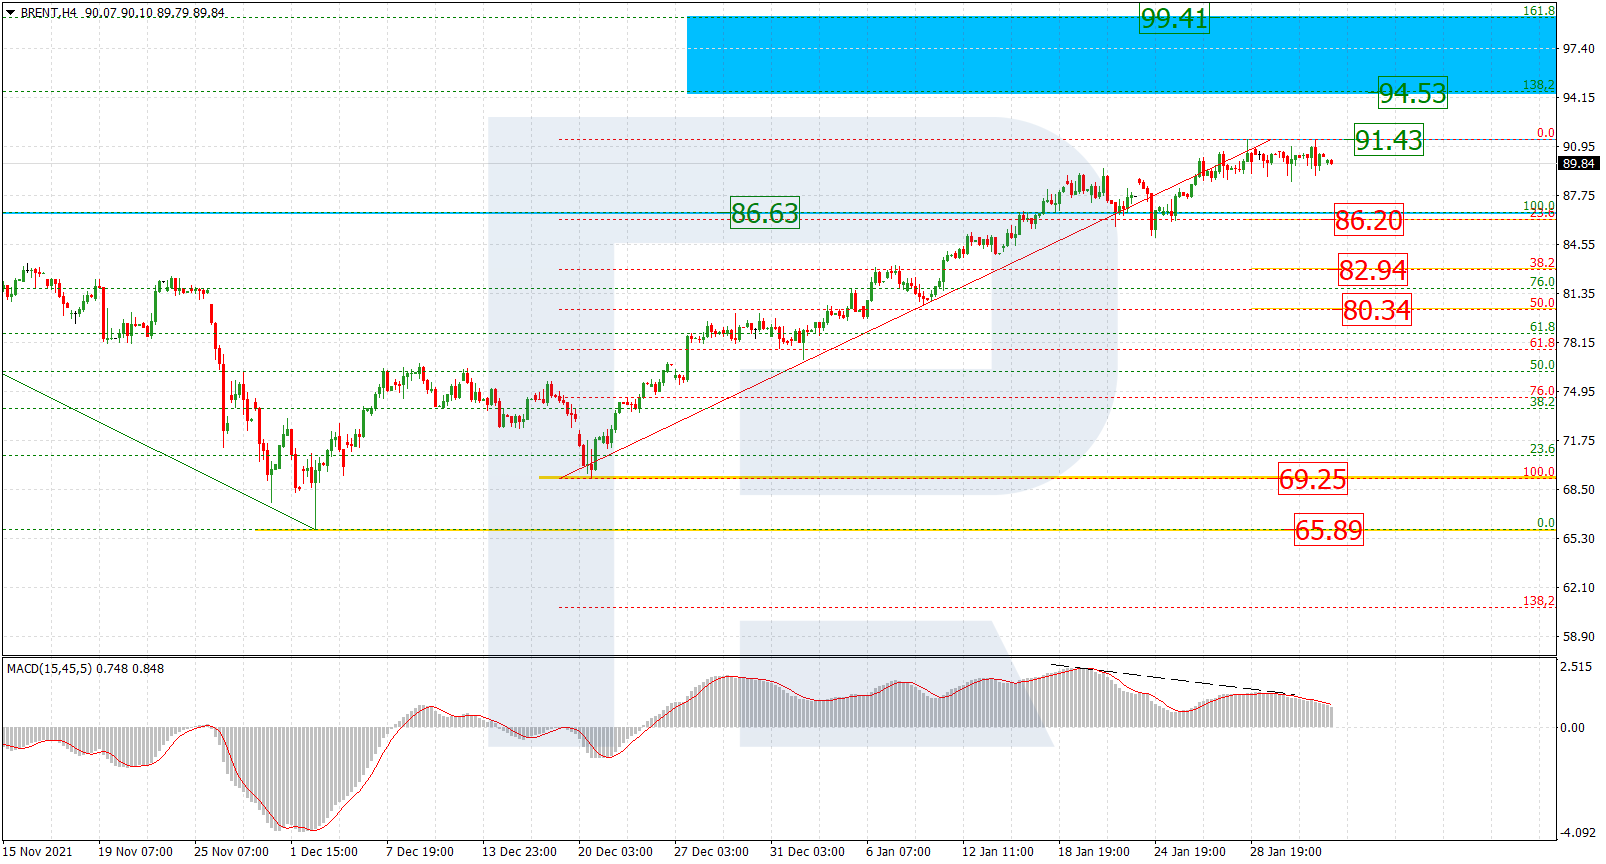
As we can see in the H4 chart, after breaking the high at 86.63 and fixing above it, Brent has stopped at 91.43. At first, the asset intended to reach the post-correctional extension area between 138.2% and 161.8% fibo at 94.53 and 99.41 respectively, but the above-mentioned level turned into strong resistance. Both this resistance and divergence on MACD are a signal in favour of a new pullback towards the local support at 69.26, a breakout of which will lead to the key one at 65.89.

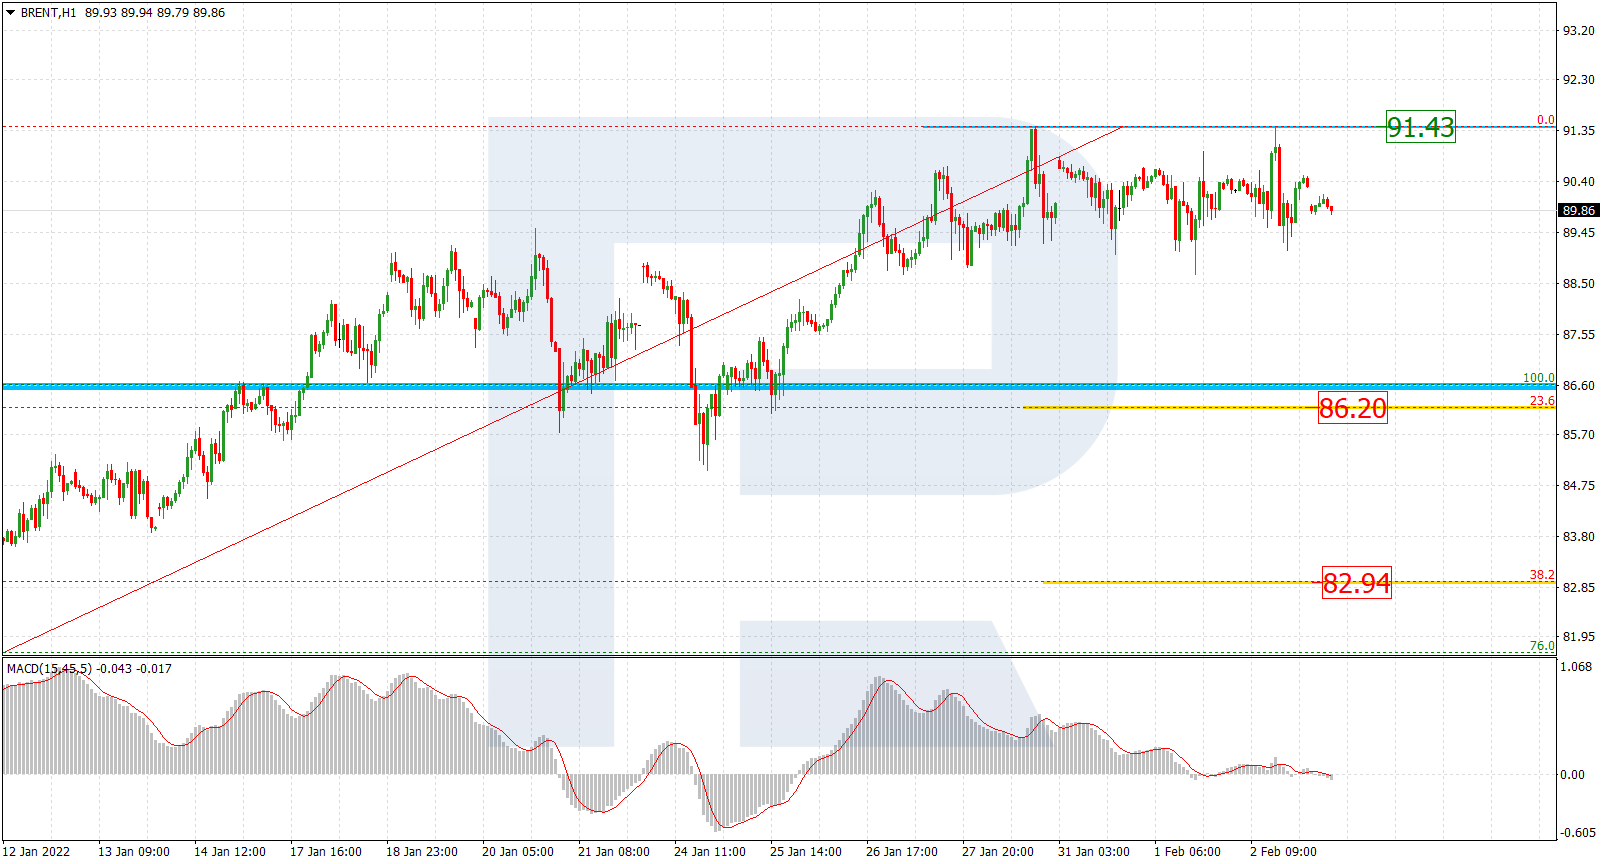
The H1 chart shows the downside correctional targets – 23.6%, 38.2%, and 50.0% fibo at 86.20, 82.94, and 80.34 respectively. A breakout of the resistance will result on a further uptrend.
Dow Jones
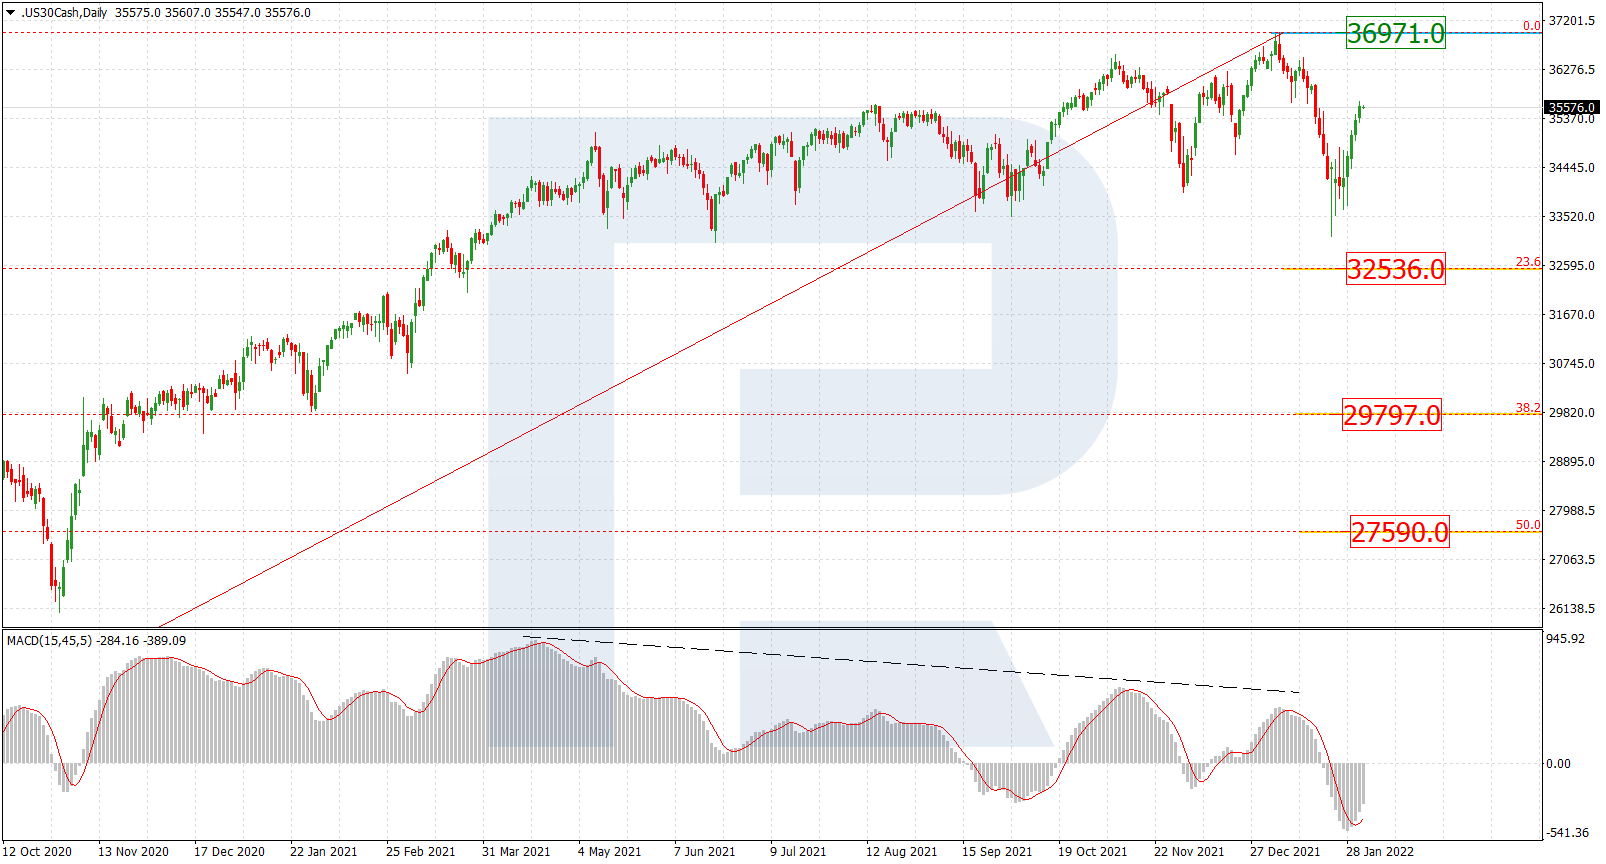
As we can see in the daily chart, after completing the first bearish wave, the asset is correcting upwards. As long as the price is trading below the high at 36971.0, the long-term downtrend may continue. The key downside targets are 23.6%, 38.2%, and 50.0% fibo at 32536.0, 29797.0, and 27590.0 respectively.
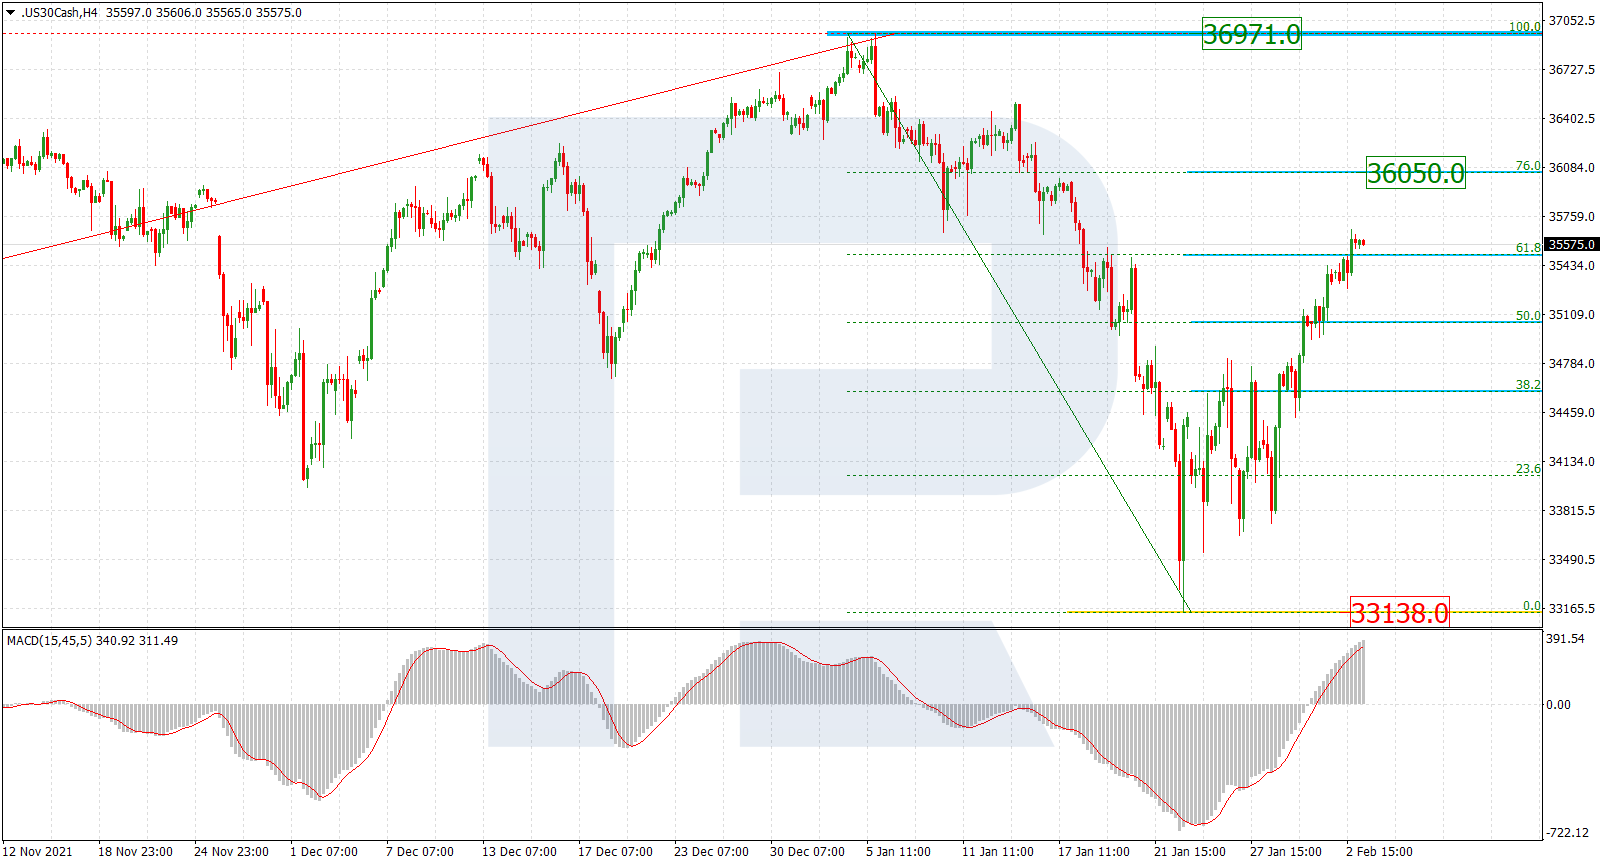
The H4 chart shows that the correctional uptrend has broken 61.8% fibo; right now, it is heading towards 76.0% fibo at 36050.0. After testing the target level, the index may reverse and fall to reach the support at 33138.0.
Forecasts presented in this section only reflect the author’s private opinion and should not be considered as guidance for trading. RoboForex bears no responsibility for trading results based on trading recommendations described in these analytical reviews.