Fibonacci Retracements Analysis 06.01.2022 (Brent, Dow Jones)
Brent
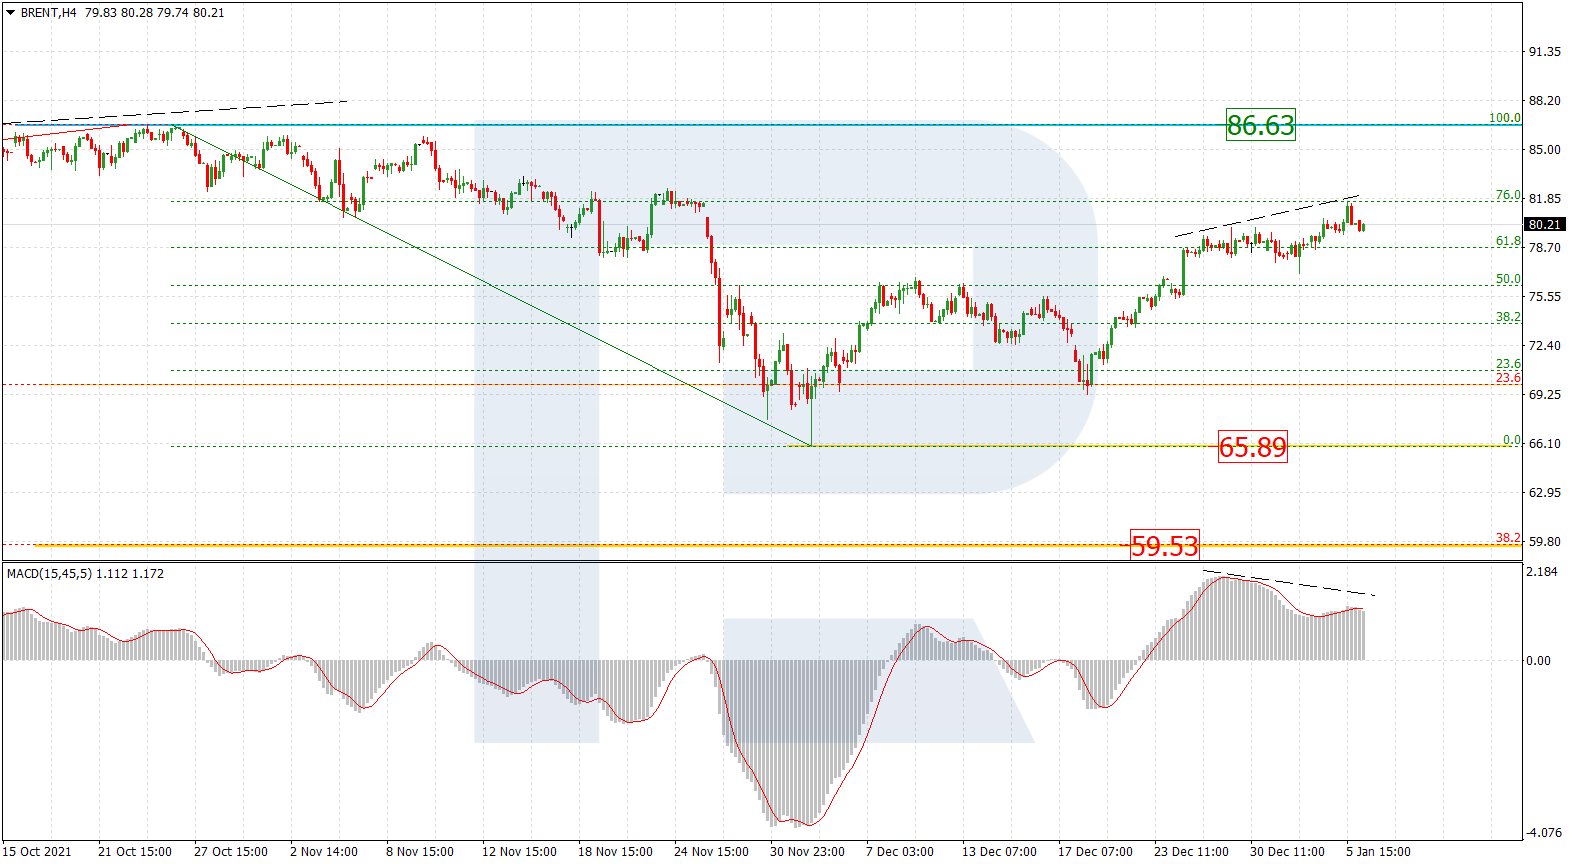
As we can see in the H4 chart, Brent has stopped moving upwards after divergence on MACD. In this case, the asset may start a new decline break the low at 65.89 and then continue falling towards long-term 38.2% fibo at 59.53. The key resistance is the high at 86.63.

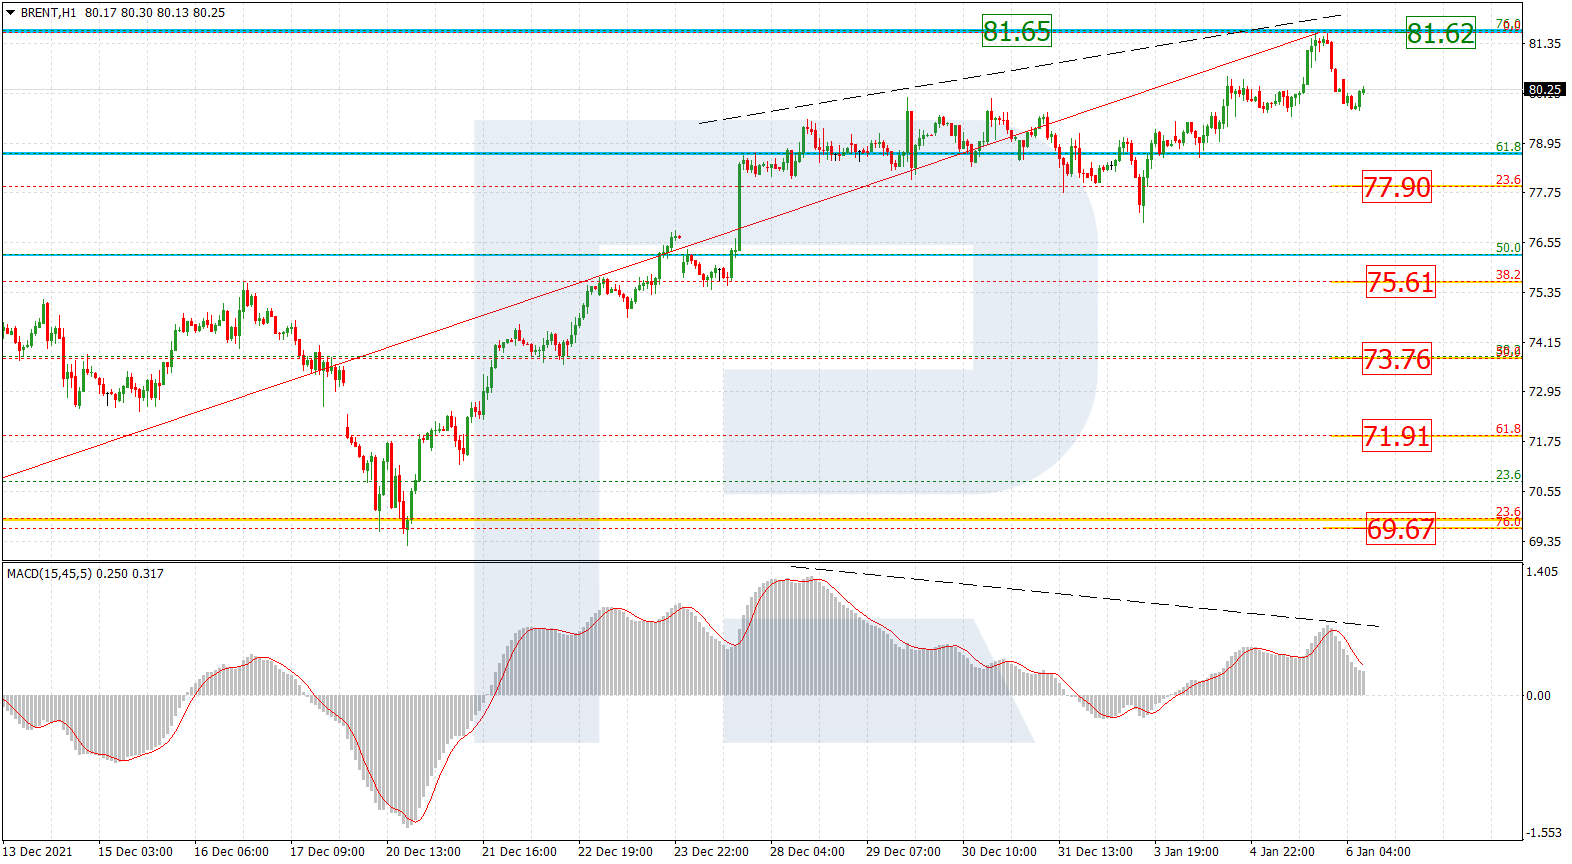
The H1 chart shows that divergence on MACD made the asset resume falling after testing 76.0% fibo at 81.65. The downside targets are 23.6%, 38.2%, 50.0%, 61.8%, and 76.0% fibo at 77.90, 75.61, 73.76, 71.91, and 69.67 respectively. The resistance is at 81.62.
Dow Jones
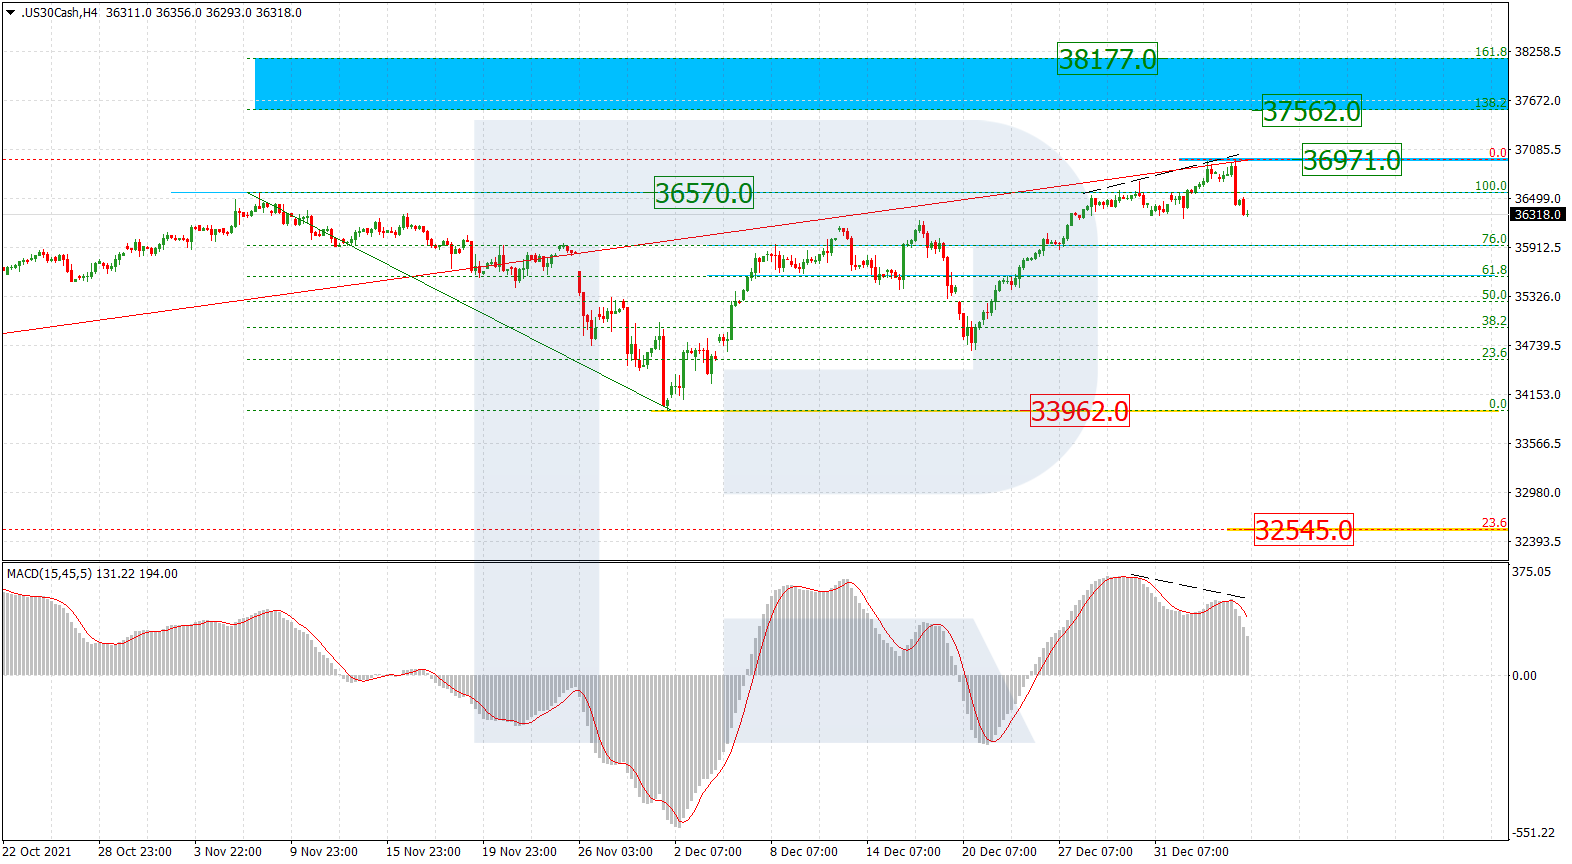
As we can see in the H4 chart, divergence on MACD made the asset start a steady descending impulse after updating the high. If the index breaks the current high at 36971.0 it may continue trading upwards to reach the post-correctional extension area between 138.2% and 161.8% fibo at 37562.0 and 38177.0 respectively. However, if the market falls and breaks the support at 33962.0, the instrument will start a long-term bearish phase.
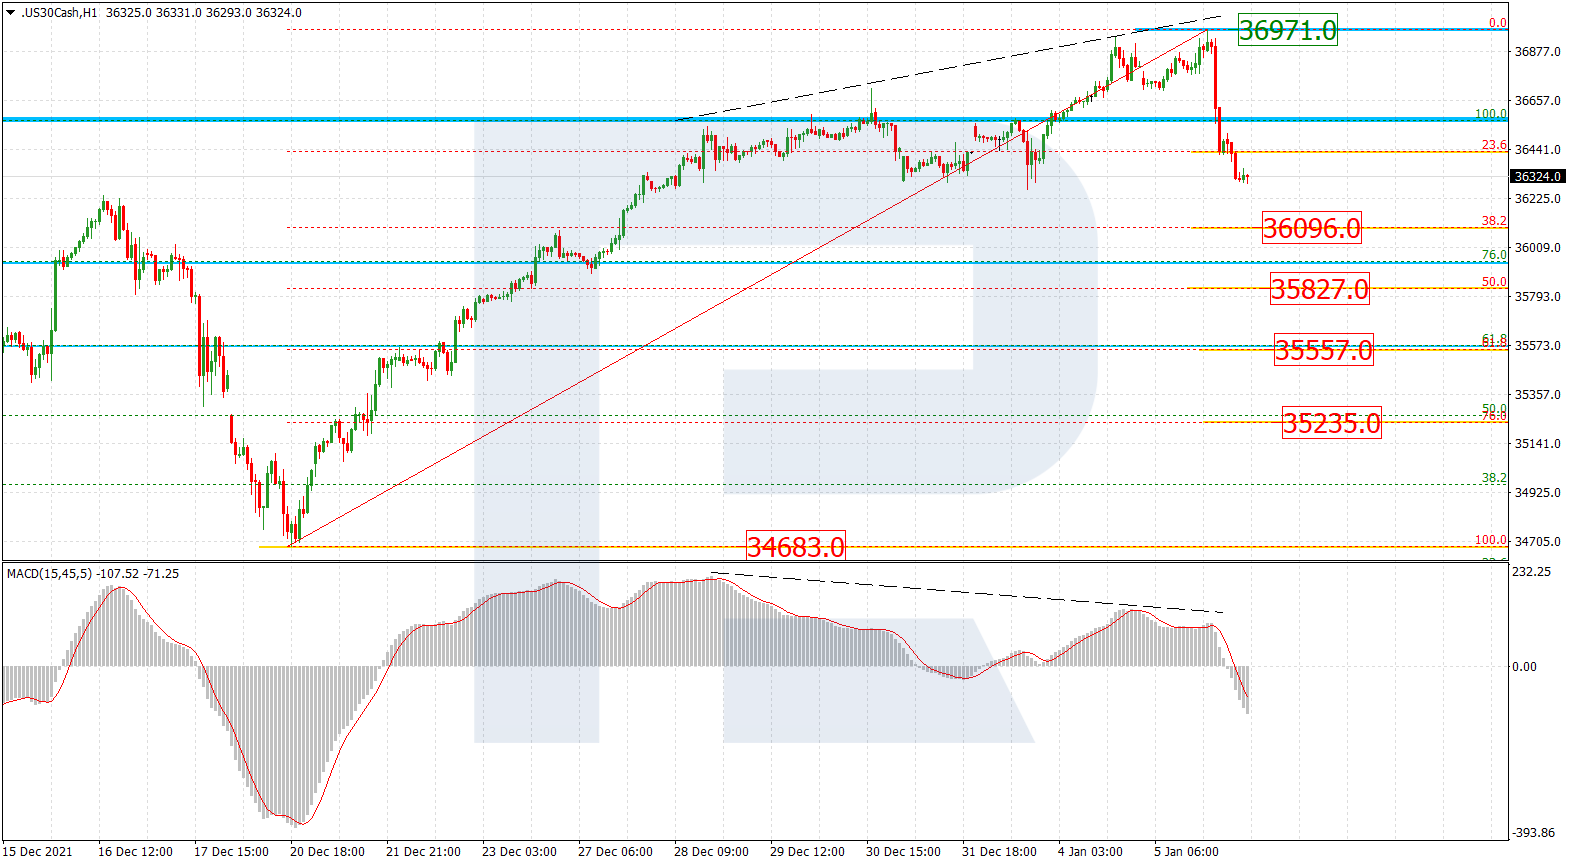
The H1 chart shows downside correctional targets after divergence on MACD – 38.2%, 50.0%, 61.8%, and 76.0% fibo at 36096.0, 35827.0, 35557.0, and 35235.0 respectively, as well as the low at 34683.0.
Forecasts presented in this section only reflect the author’s private opinion and should not be considered as guidance for trading. RoboForex bears no responsibility for trading results based on trading recommendations described in these analytical reviews.