Fibonacci Retracements Analysis 28.12.2021 (EURUSD, USDJPY)
EURUSD, “Euro vs US Dollar”
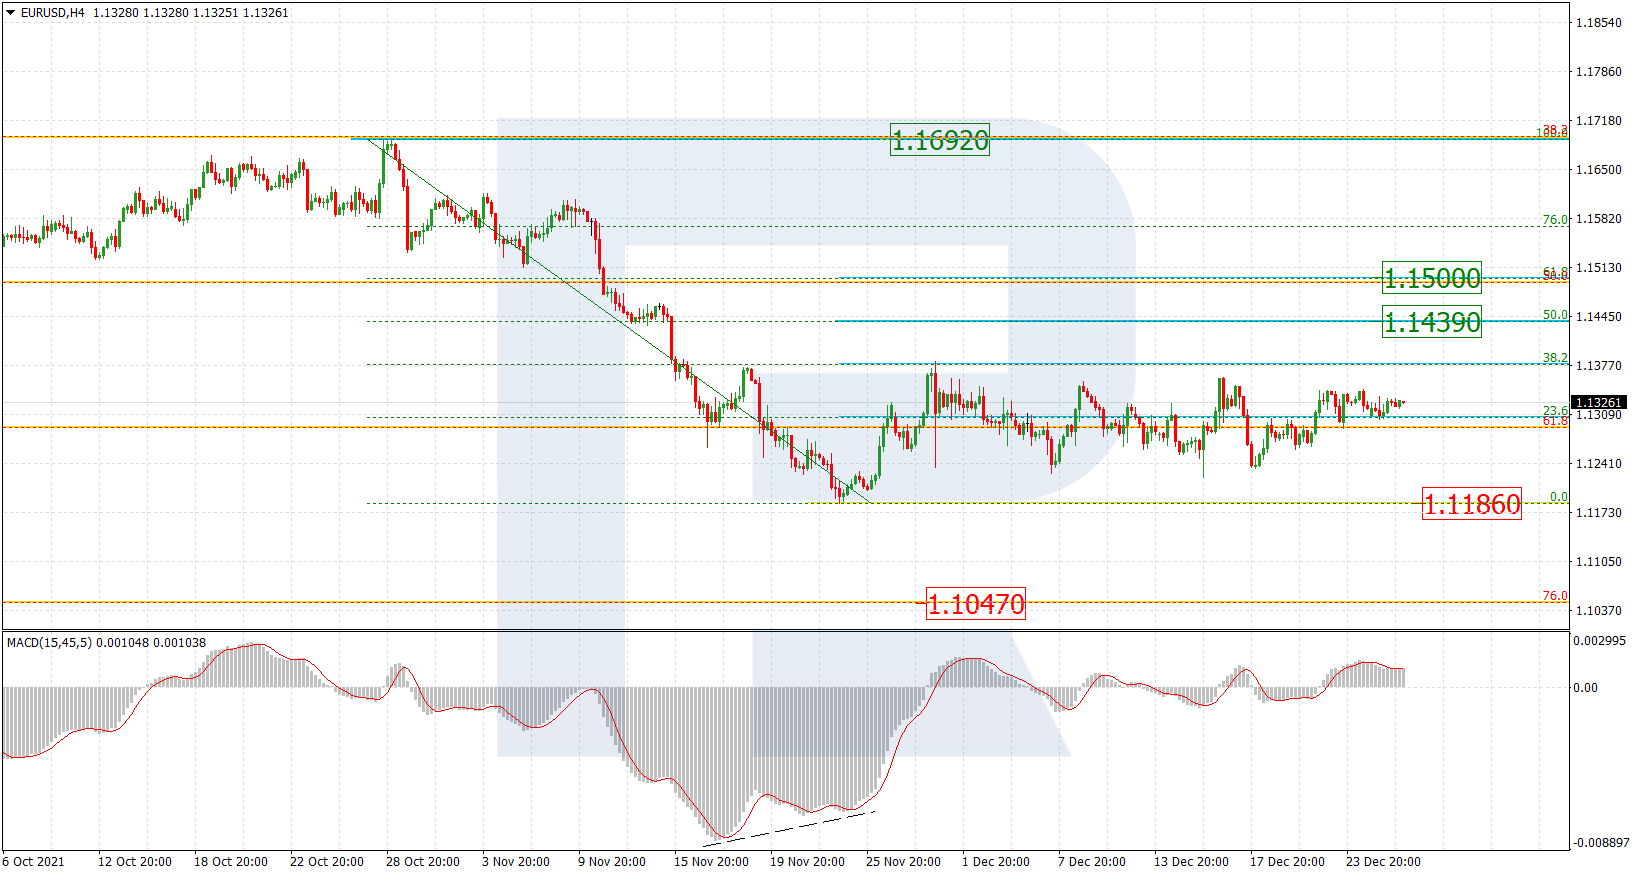
As we can see in the H4 chart, EURUSD is still consolidating at 23.6% fibo and correcting the previous descending wave; the correctional wave has already reached 38.2% fibo after convergence on MACD. The current technical picture implies two possible scenarios – a new rising impulse towards 50.0% and 61.8% fibo at 1.1439 and 1.1500 respectively, and a further downtrend to reach the low at 1.1186, a breakout of which may lead to the mid-term 76.0% fibo at 1.1047. The key resistance is at 1.1692.

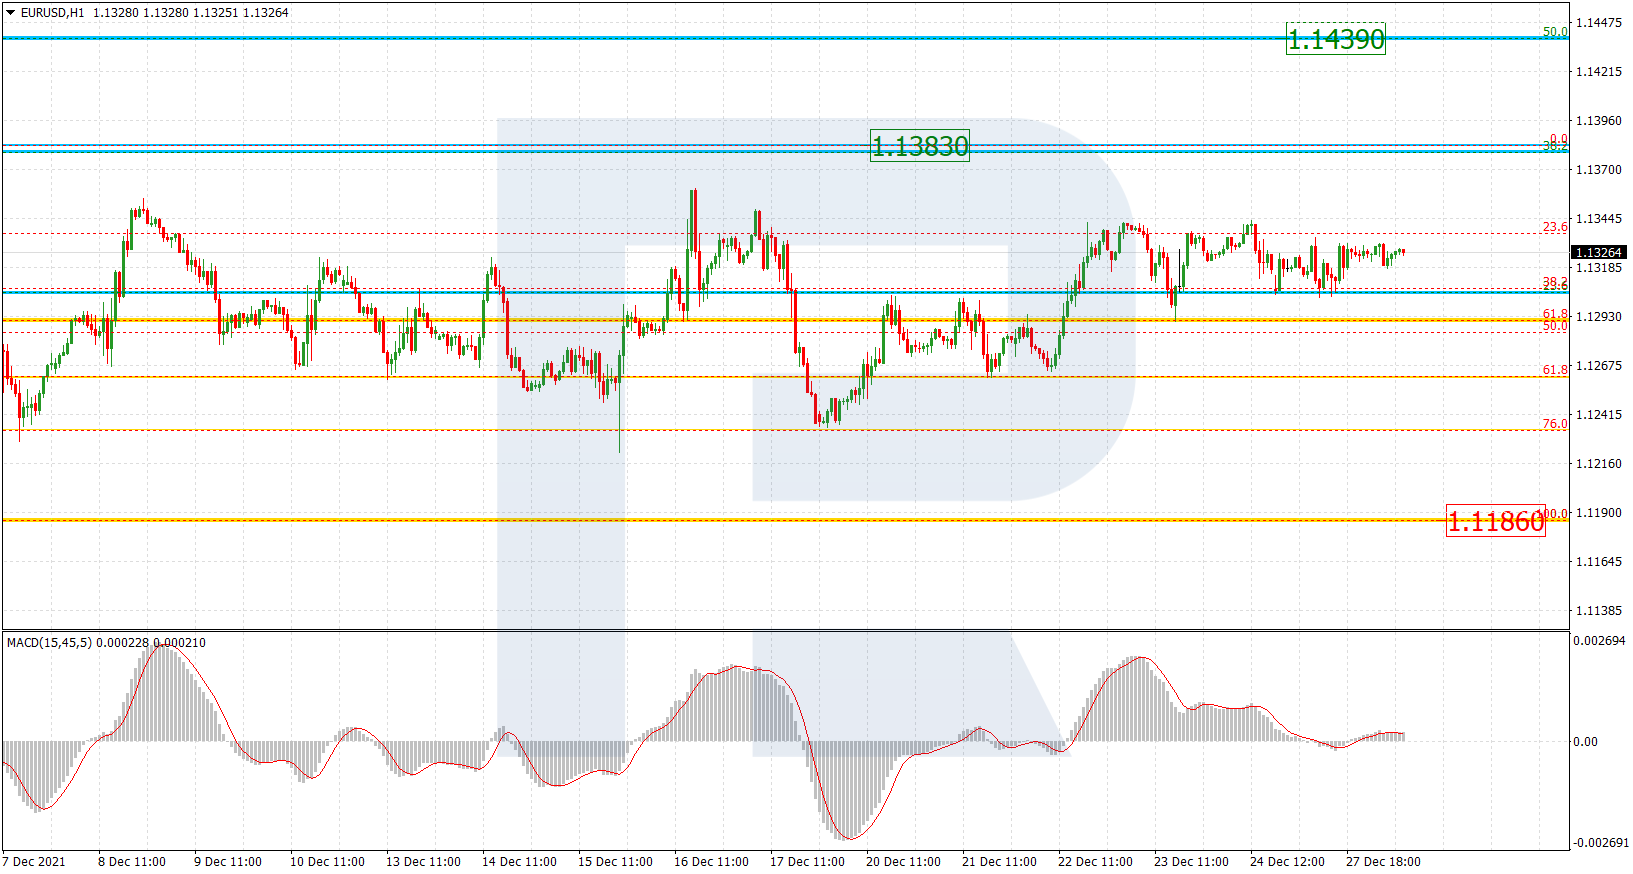
The H1 chart shows a more detailed structure of the current consolidation range, which may be considered as a correction after the rising wave. A quick and volatile correctional impulse to the downside after local divergence on MACD has reached 76.0% fibo. At the moment, the asset is trading between 23.6% and 38.2% fibo, while the next rising impulse may be heading to break the high at 1.1383.
USDJPY, “US Dollar vs. Japanese Yen”
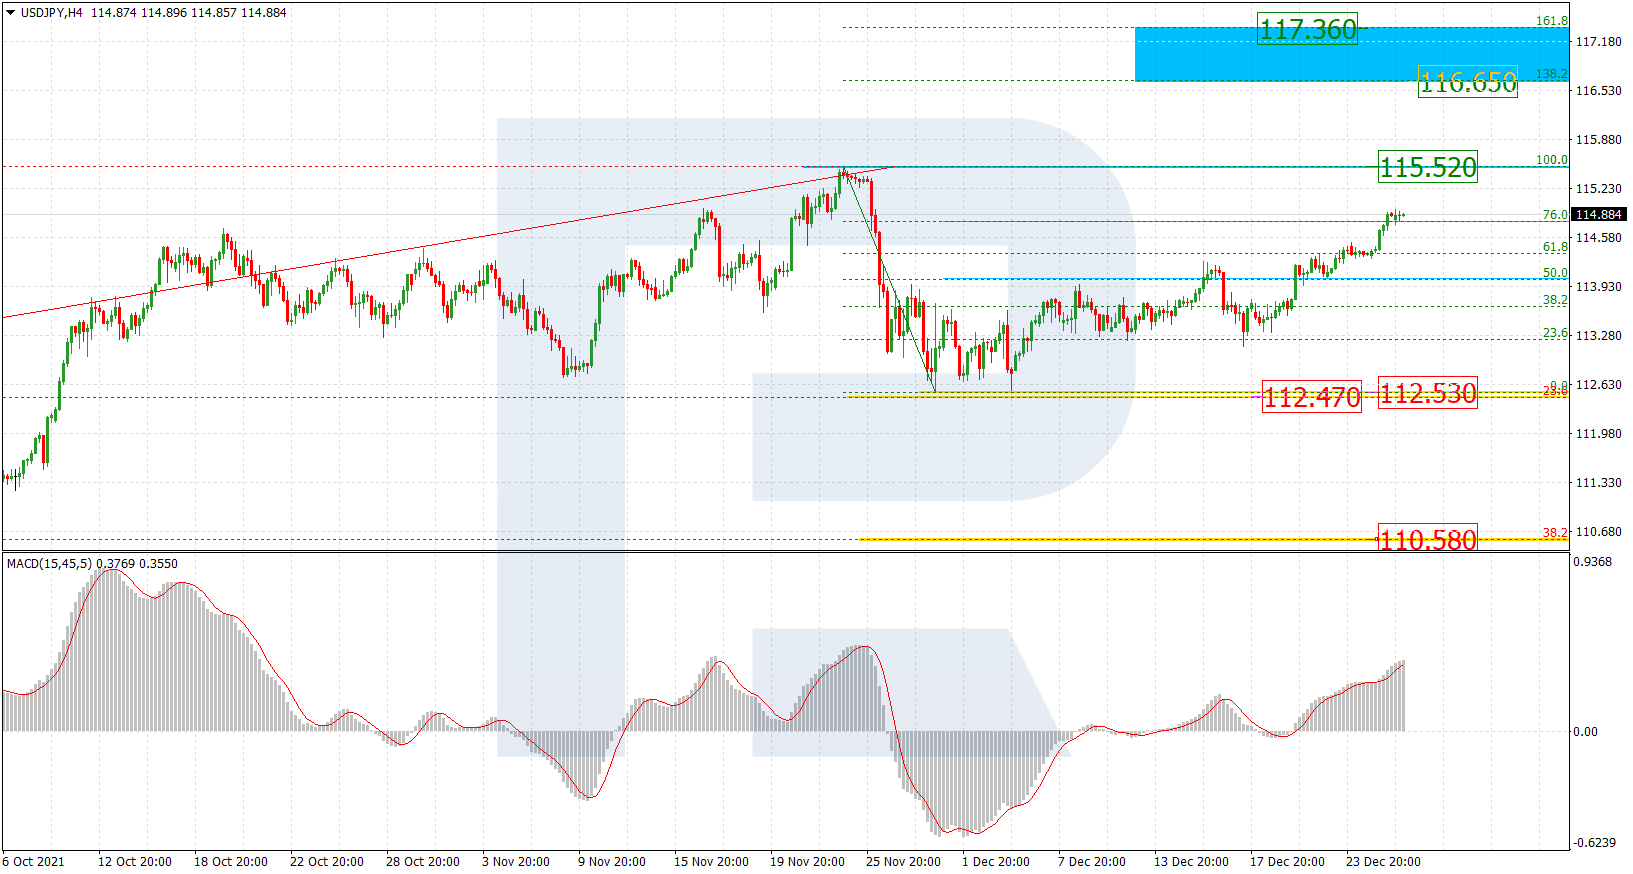
As we can see in the H4 chart, after completing a quick descending wave towards 23.6% fibo at 112.47, USDJPY is forming a steady rising impulse to reach the high at 115.52. If the pair fails to break the high, it may resume falling to reach 38.2% and 50.0% fibo at 110.58 and 109.06 respectively. On the other hand, if the pair succeeds, it may continue growing towards the post-correctional extension area between 138.2% and 161.8% fibo at 116.65 and 117.36 respectively.
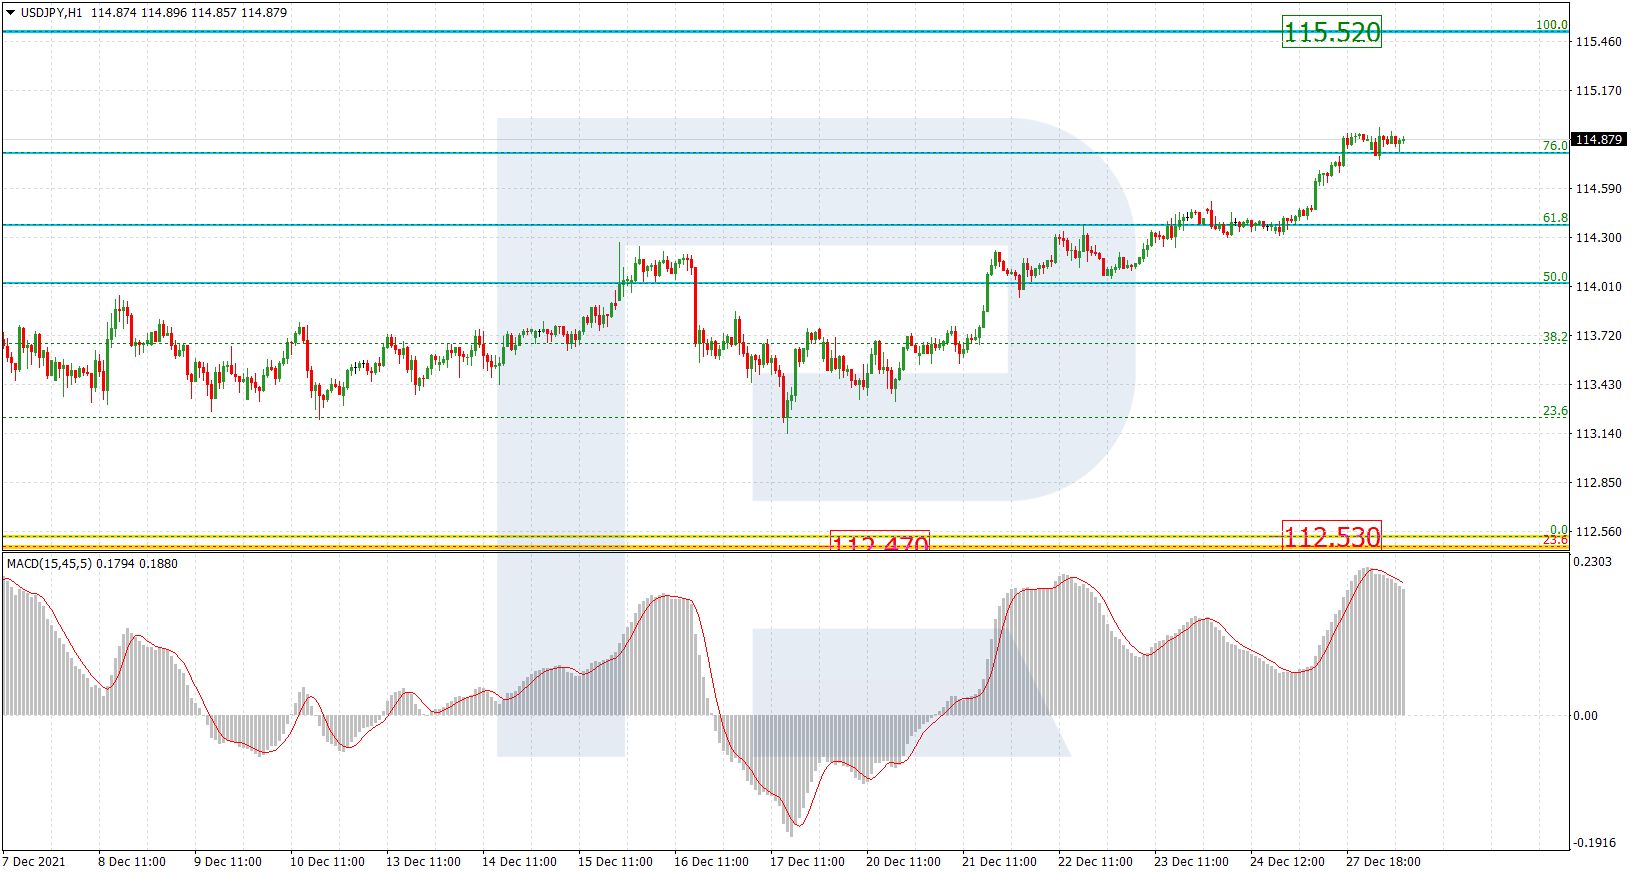
In the H1 chart, the pair has reached 76.0% fibo; right now, it is trying to break this level and fix above it. Later, the market may continue growing towards the high. The support is the low at 112.53.
Forecasts presented in this section only reflect the author’s private opinion and should not be considered as guidance for trading. RoboForex bears no responsibility for trading results based on trading recommendations described in these analytical reviews.